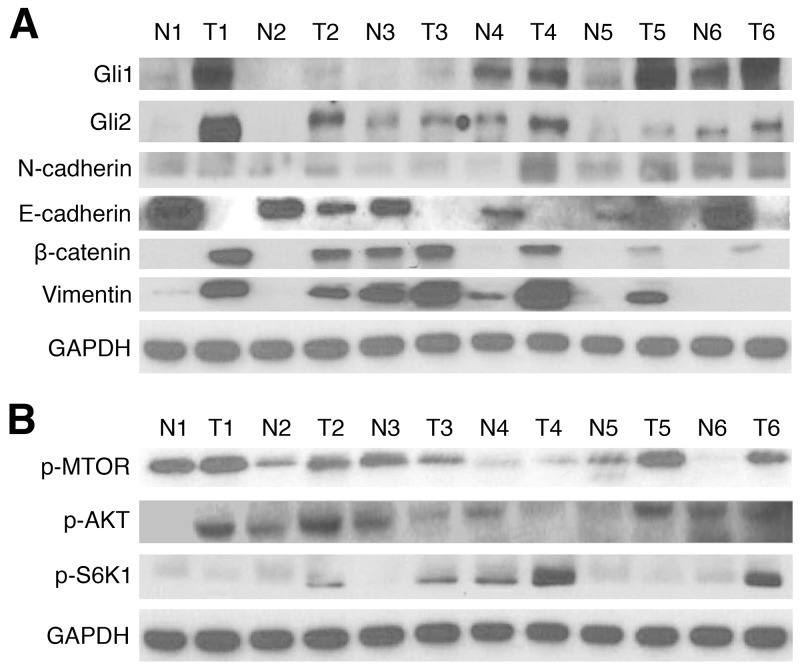
Figure 1. Gli1/2, EMT, and AKT pathway markers are upregulated in EAC tissue samples.
(A) Western blots of Gli1 and Gli2 protein expression in 24 matched pairs of esophageal tumor (T) and normal (N) tissues. GAPDH served as a loading control; results of 6 numbered, representative sample pairs are shown here. EMT markers (E-cadherin, N-cadherin, Vimentin, and β-catenin) were also examined. (B) Western blots of AKT pathway protein (p-MTOR, p-AKT, and p-S6K1) expression in 24 matched pairs of esophageal T and N tissues. GAPDH served as a loading control; results of 6 representative sample pairs are shown.

