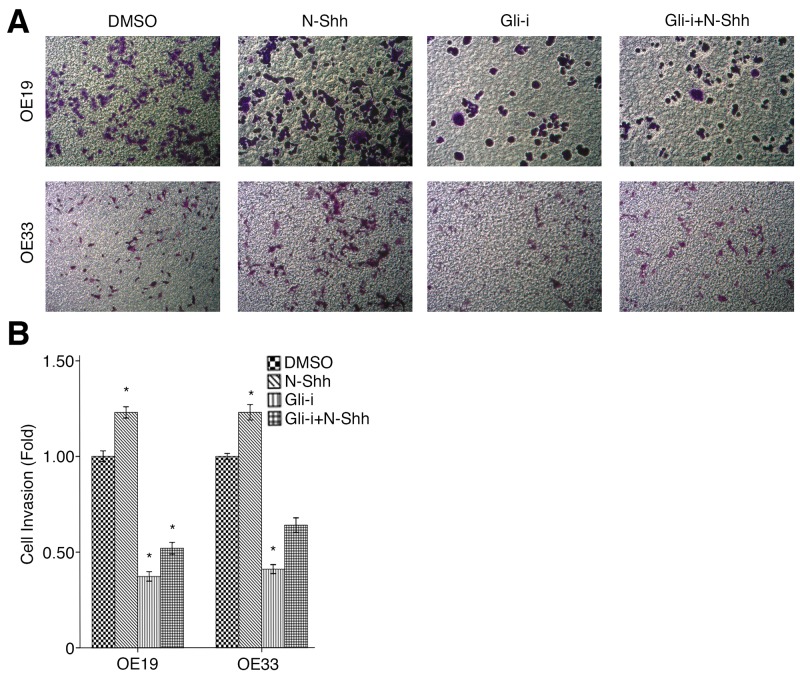
Figure 5. Gli signaling promotes cell invasion in EAC.
(A) Transwell invasion assay of EAC OE19 and OE33 cells, treated with DMSO (control), N-Shh (0.5 mg/mL), Gli-i (500 nmol/L), or Gli-i (500 nmol/L) with N-Shh (0.5 mg/mL) stimulation. Representative images captured by a light microscope are shown (100x). (B) Quantification of transwell invasion assays, expressed as fold change in comparison to the control group (p-values of < 0.05, < 0.01, or < 0.001 were indicated as *, **, or ***, respectively).

