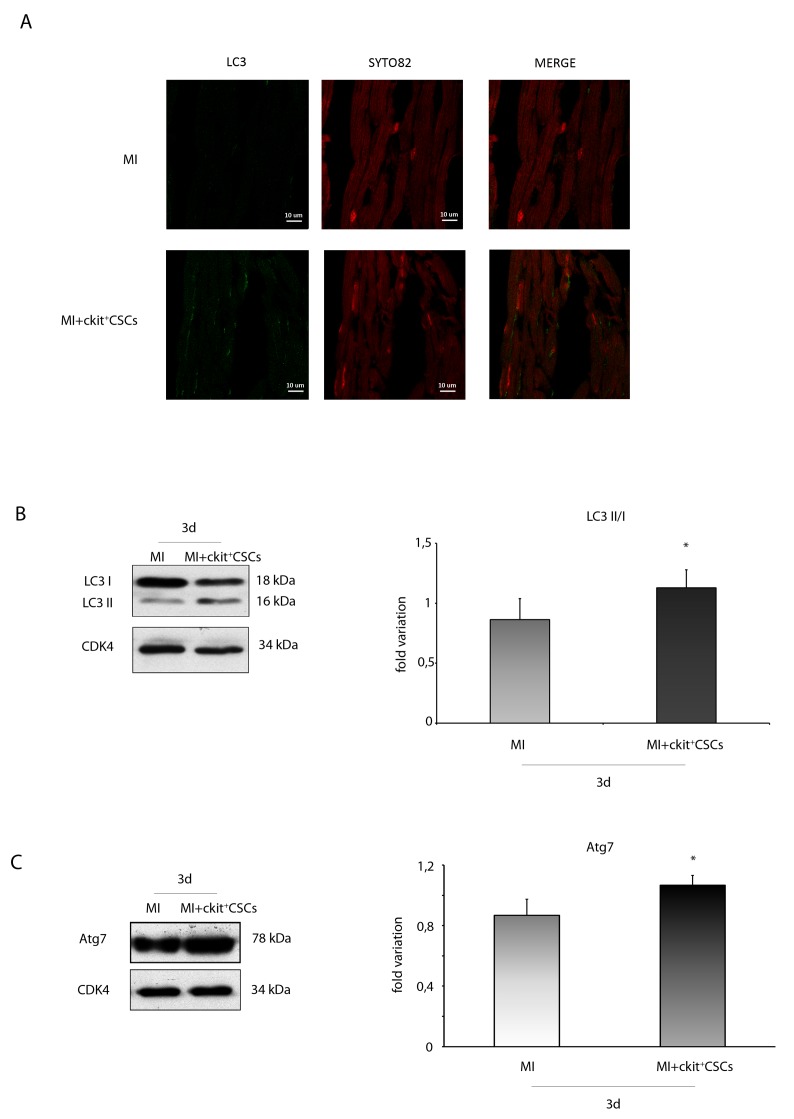
Figure 11. ckit+CSCs modulate the expression of autophagic markers in treated infarcted hearts.
Representative images of immunofluorescence for LC3 (A) of heart tissue sections from 3 day-infarcted control hearts (MI) or ckit+CSC transplanted hearts (MI+ckit+CSCs). Left panel: green fluorescence indicates LC3 labeling. Central panel: orange fluorescence indicates SYTO 82 Orange Fluorescent staining of nuclei. Right panel: merge of both images. Western blot analysis showing the expression of (B) LC3 and (C) Atg7, in the border zone of 3 day-infarcted control hearts (MI, n=3) or ckit+CSC transplanted hearts (MI+ckit+CSCs, n=3). Left panel: A representative Western blotting of three independent experiments is shown. Right panel: Densitometric analysis of Western blot. Data are shown as means ± SEM. *P < 0.05 vs MI.

