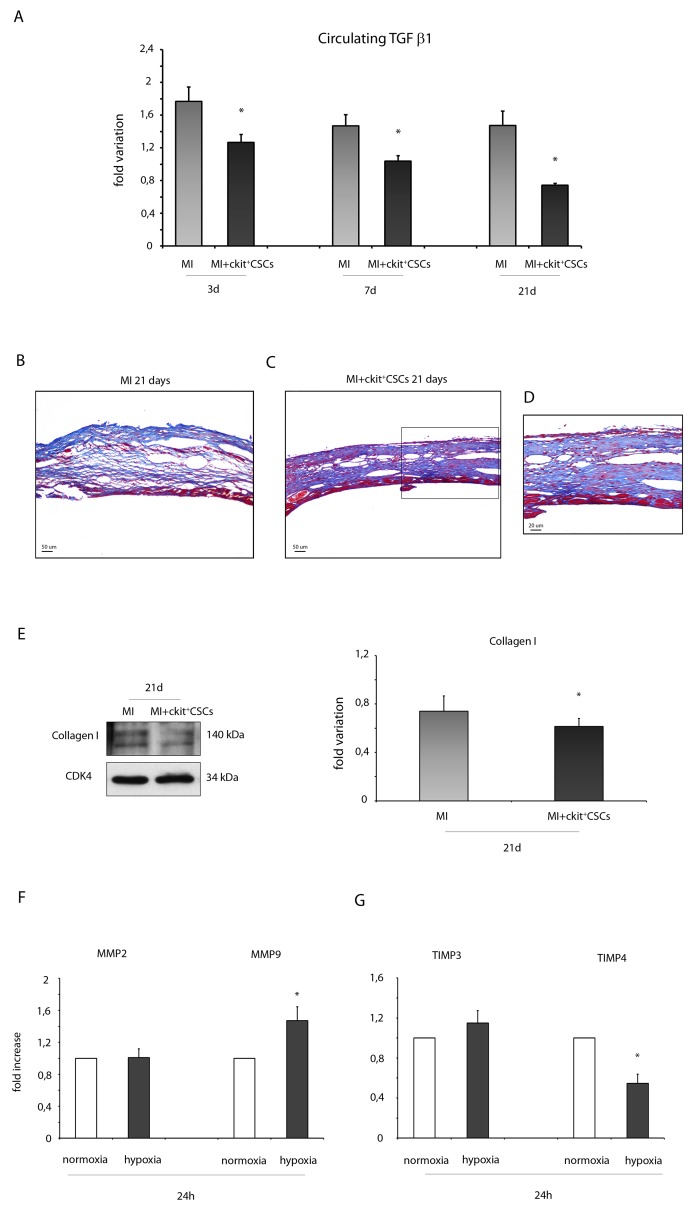
Figure 9. ckit+CSCs reduce the expression of fibrotic markers.
(A) Circulating levels of TGF β1 detected by Luminex assay 3, 7 and 21 days following surgery in the serum of PBS treated infarcted mice used as controls (MI, n=4) and ckit+CSC transplanted infarcted mice (MI+ckit+CSCs, n=4), all normalized for their controls. Data are shown as means ± SEM. *P<0.05 vs MI. (B-D) Representative Azan-Mallory staining photomicrographs of control (MI) (B) and ckit+CSC transplanted infarcted hearts (MI+ckit+CSCs) (C, D) depicting fibrosis (blue area), 21 days after treatment. (D) represents high magnification of the insets shown in (C). (E) Collagen I expression in 21 day-infarcted control hearts (MI, n=3) or ckit+CSC transplanted hearts (MI+ckit+CSCs, n=3) by Western blot (left panel) and relative densitometry of 3 independent experiments (right panel). Data are shown as means ± SEM. *P < 0.05 vs MI. (F) MMP2 and MMP9, (G) TIMP3 and TIMP4 mRNA expression by real time PCR in normoxic and hypoxic ckit+CSCs at 24h. Data were normalized to GUSB, a housekeeping gene and represent means ±SEM; Data were obtained from 3 independent experiments. *p< 0.02 vs normoxic ckit+CSCs.

