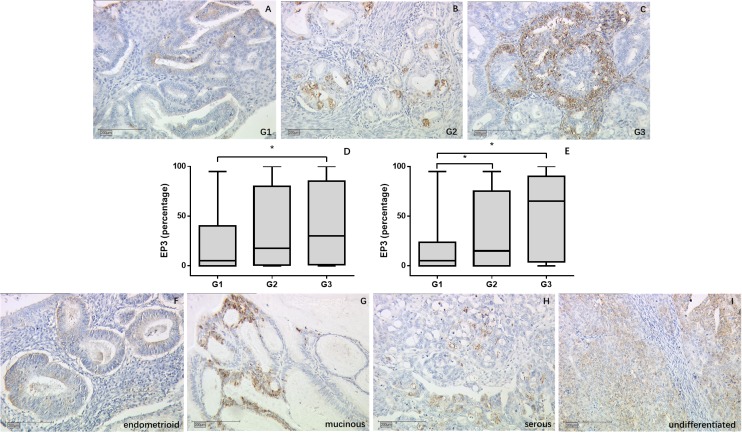
Figure 1. EP3 expression in EC tumor samples detected by immunohistochemistry.
(A-C) Representative microphotographs of EP3 staining in different grading of EC tissue. (D, E) EP3 expression is associated with grading with weakest staining in G1 tumors in overall cohort and endometrioid tumor subgroup. *p < 0.05. (F-I) Representative microphotographs of EP3 staining in different histological subtypes of EC tissue. Scale bars equal 200 μm.

