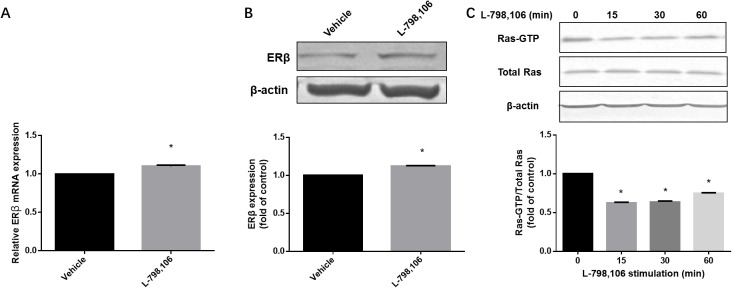
Figure 7. EP3 antagonist increases expression of ERβ and decreases activity of Ras in RL95-2 cells.
(A) Cells treated either by vehicle (0.1% (v/v) DMSO) or 1μM L-798,106 for 4 h and subjected to RT-PCR. Bar graph represents mean ± SEM (n = 4). *p < 0.001 (compared to vehicle treated group). (B) Cells treated either by vehicle (0.1% (v/v) DMSO) or 1μM L-798,106 for 12 h and subjected to western blotting. Histogram illustrates the ratio of ERβ to β-actin as assessed with pooled densitometric data. Data was normalized to the expression of vehicle treated group. β-actin was used as loading control. Bar graph represents mean ± SEM (n = 3). *p < 0.001 (compared to vehicle treated group). (C) Cells incubated with 1μM L-798,106 for indicated time and subjected to western blotting. Data was normalized to the expression at 0 min. β-actin was used as loading control. Bar graph represents mean ± SEM (n = 3). *p < 0.001 (compared to 0 min group). For gel source data, see Supplementary Figure 4.

