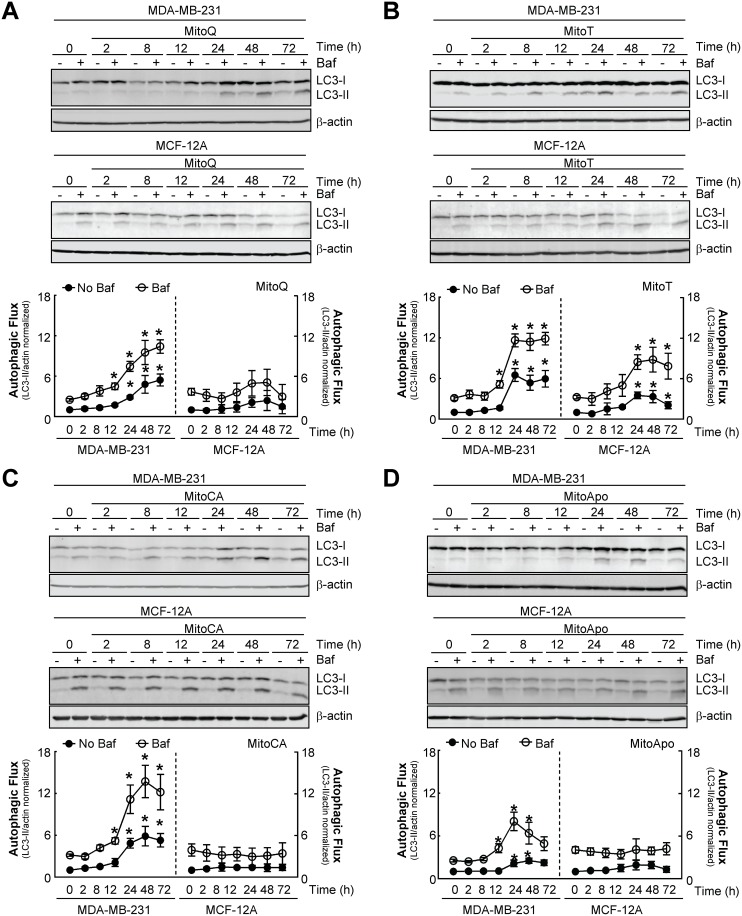
Figure 2. MTA-induced autophagy is selective for MDA-MB-231 cells as compared to MCF-12A cells.
(A-D) Autophagic flux kinetic analyses using LC3 immunoblotting from MDA-MB-231 and MCF-12A cells exposed to 1 μM of (A) MitoQ, (B) MitoT, (C) MitoCA or (D) MitoApo in the presence and absence of 5 nM Baf at the indicated times. Baf was added for 2 hours prior to protein harvest. Bars represent mean ± SEM. (n=4) *P<0.05 indicates statistical significance.

