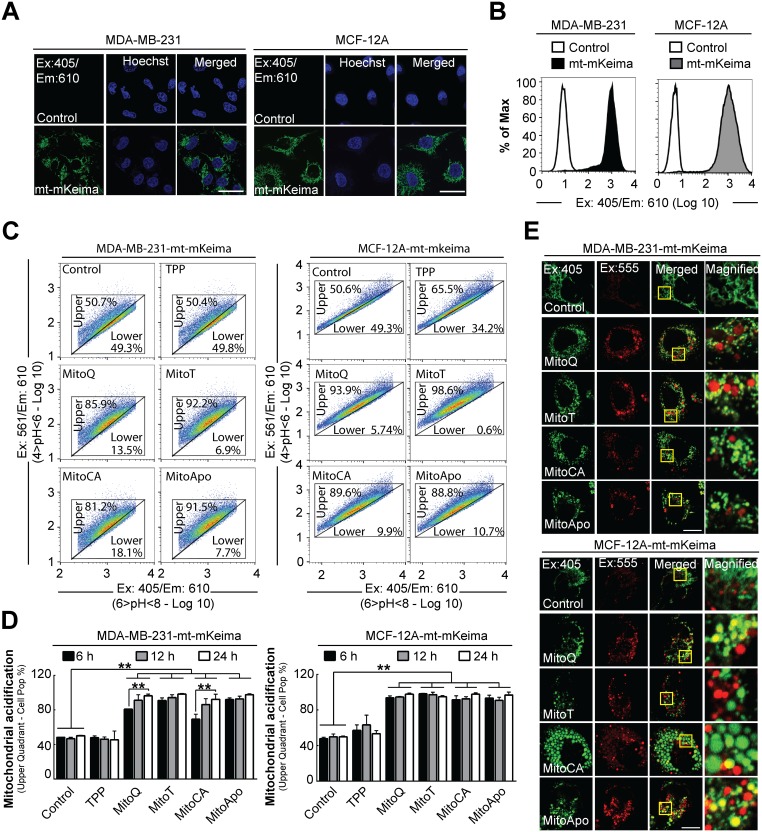
Figure 4. Mitochondrial acidification in stably-expressing mt-mKeima MDA-MB-231 and MCF-12A cells.
Stable mt-mKeima expressing MDA-MB-231 and MCF-12A cell lines were generated to analyze mitochondrial pH changes in breast cancer and non-cancer cell lines. To verify mitochondrial location, confocal images were captured of stably expressing empty vector (pLVX) or mt-mKeima (pLV-mt-mKeima) (A) MDA-MB-231 and MCF-12A cells (Ex: 405 nm/Em: 610 nm). Scale bar is 40 μm. (B) Representative FACS histogram of MDA-MB-231 and MCF-12A cells expressing an empty vector or mt-mKeima using Ex:405 nm/Em:610 nm. (C) Representative 610 nm emission population analysis of the mt-mKeima pH excitation shift from 405 nm (4>pH<6) to 561 nm (6>pH<8) of the stable cells treated with DMSO (control) or 1 μM MTAs for 12 hours. (D) Quantification of mt-mKeima fluorescent shift to the upper quadrant in cell populations at 6, 12 and 24 hours of 1 μM MTA treatments. Bars represent mean ± SD. The number of cells counted for each FACS analysis was 50,000 events per experiment. (n=3) (E) Representative confocal images (Ex. 405 nm/Em: 610 nm and Ex: 555/Em: 610) of MTA treated cells stably expressing mt-mKeima at 24 hours post treatment. Scale bar is 20 μm. Yellow box indicates the area that was magnified. *P<0.05 and **P<0.01 indicate statistical significance.

