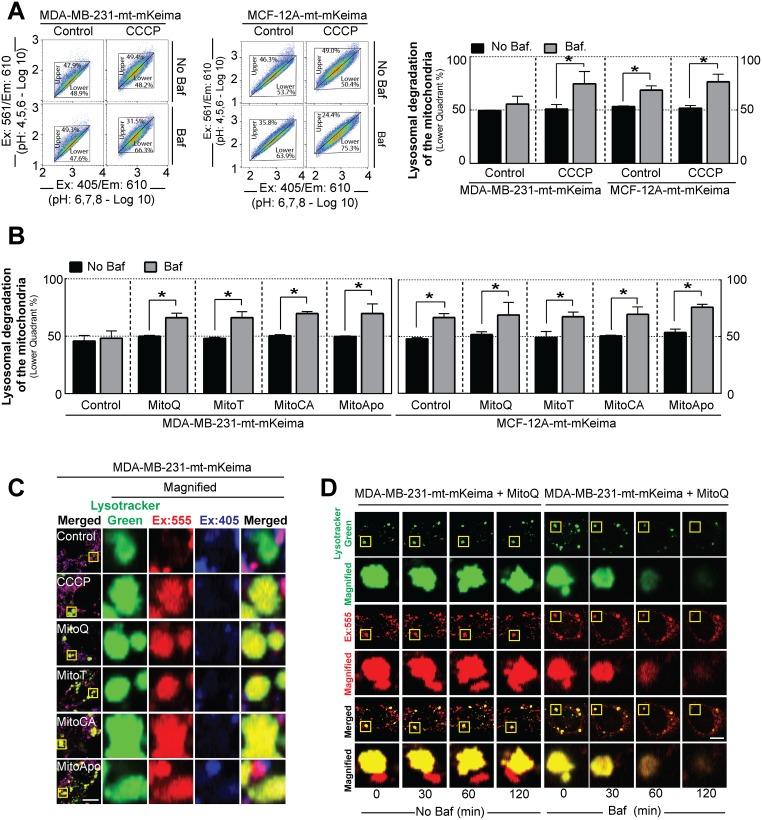
Figure 5. Lysosomal degradation of the mitochondria is selective for MDA-MB-231 cancer cells as compared to MCF-12A healthy cells.
(A) Representative 610 nm emission population analysis of the mt-mKeima pH excitation shift from 405 nm (4>pH<6) to 561 nm (6>pH<8) of the stably expressing MDA-MB-231 and MCF-12A cells treated with or without 30 mM CCCP for 3 hours in the presence or absence of 5 nM Baf for 2 hours prior to analyses. Bar represents the mean ± SD. (n=3). (B) Cell populations were analyzed for mt-mKeima pH shifts to lower quadrant using MDA-MB-231 and MCF-12A cells treated with 1 μM of MTAs for 12 hours in the presence 5 nM Baf for 2 hours prior to analysis. Bar represents the mean ± SD. (n=3) (C) Representative confocal images of mt-mKeima fluorescent emission at 610 nm after excitation at 405 and 555 nm in stably expressing MDA-MB-231 cells treated with different MTAs at 1 μM for 24 hours in the presence of 100 nM Lysotracker Green. Scale bar is 10 μm. (D) Kinetic confocal analysis of mt-mKeima fluorescent emission at 610 nm after excitation at 555 nm in stably expressing MDA-MB-231 cells treated with MitoQ at 1 μM for 24 hours in the presence of 100 nM Lysotracker with and without Baf. Scale bar is 10 μm. *P<0.05, and **P<0.01 indicate statistical significance.

