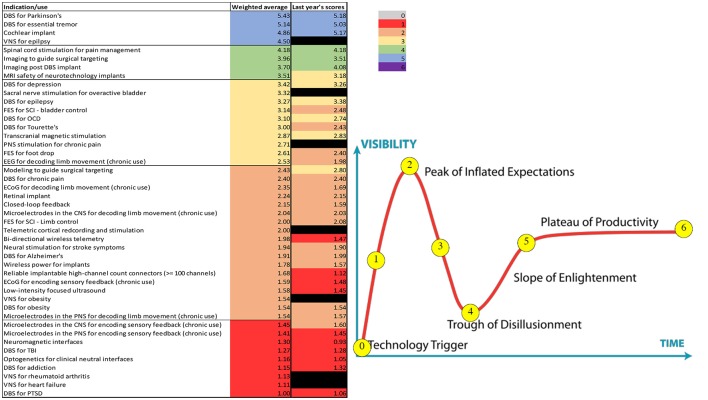
Figure 14.
Representation of the anonymous annual survey results, polling the participants of the DBS Think Tank on the hype cycle positions of different DBS related neurotechnological advances and indications. On the right side, the hype cycle graph (adapted Jackie Fenn, “When to leap on the hype cycle,” Decision Framework DF-08-6751, Research Note, GartnerGroup RAS Services, June 30, 1999 with permission) that represents the different stages of development. On the left side, a table summarizing the weighted averages of the position of the different neurotechnological indications or uses on the hype cycle graph. Positions 0 to 6 are color coded as noted.

