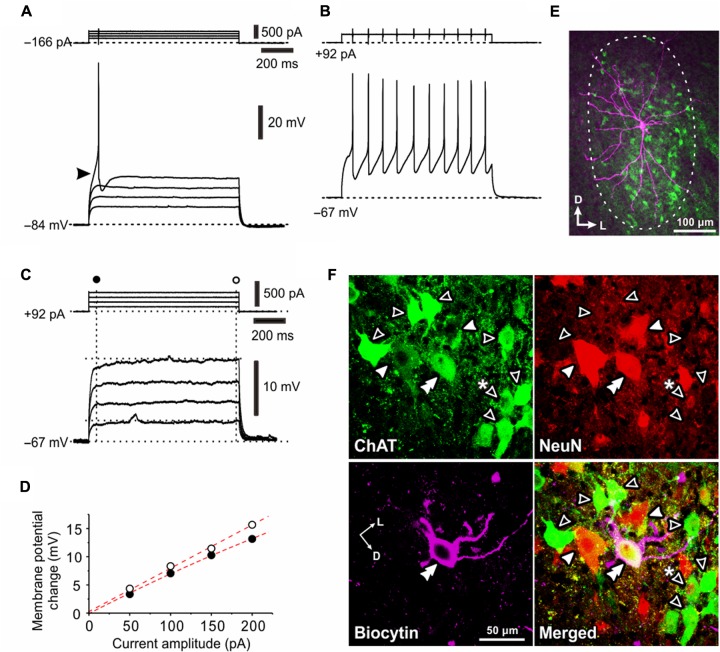
FIGURE 3.
Electrophysiological membrane properties of Type II αMNs. (A,B) Spike responses evoked by injection of depolarizing current pulses applied in a neuron classified as Type II αMN at –84 and –67 mV, respectively, which were brought about by a negative and positive DC current injections of –166 pA (A) and 92 pA(B), respectively. An arrowhead indicates an LTS-like response (A). (C) Subthreshold membrane potential responses to depolarizing current pulses applied in the same Type II αMN at –67 mV. (D) A relationship between the amplitude of depolarizing current pulse and the membrane potential change measured 50 ms after the pulse onset (C, filled circles) and that measured 10 ms before the pulse offset (C, open circles). (E) A fluorescence image of the recorded neuron labeled with biocytin (pink) located among ChAT(+; green) MNs in the center of the TMN, showing multiple primary dendrites extending almost the whole TMN. (F) Confocal images showing immunoreactivity for ChAT (green), NeuN (red), and biocytin (pink). Merged, a merged fluorescence image. A double filled arrowhead indicates a biocytin-labeled ChAT(+) and NeuN(+/N, +/C) αMN. Filled arrowheads indicate ChAT(+) and NeuN(+/N, +/C) αMNs. Open arrowheads indicate ChAT(+) and NeuN(–/N, –/C) non-α type MNs. Open arrowhead with asterisk indicates a ChAT(+) and NeuN(+/N, –/C) non-α type MNs.

