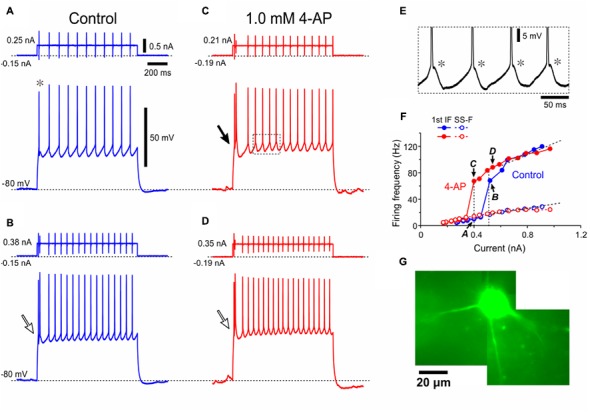
FIGURE 4.

A Type II presumed-αMN displays 4-AP sensitive K+ currents and LTS. (A–D) Spike trains evoked in response to depolarizing current pulses applied in a Type II presumed-αMN at –80 mV which was brought about by negative DC current injections before (A,B) and after application of 1 mM 4-AP (C,D). Note the smaller amplitude of the first spike (asterisk). Open and filled arrows indicate bursts caused by LTS (B–D, filled and open arrows). (E) The enlargement of the portion of the trace surrounded by a rectangle in (C) showing spike-ADPs (asterisks). (F) Relationships between the current amplitudes and the first IFs or the SS-Fs before and after application of 4-AP (blue and red filled or open circles, respectively). The I–F slope for the first IF, 52 Hz/nA. The I–F slope for the SS-F, 28 Hz/nA. The plots denoted by arrows with letters of A–D represent the relationships obtained from the spike trains evoked by the corresponding currents shown in (A–D). (G) A lucifer yellow image of the recorded Type II presumed-αMN which has the multipolar soma.
