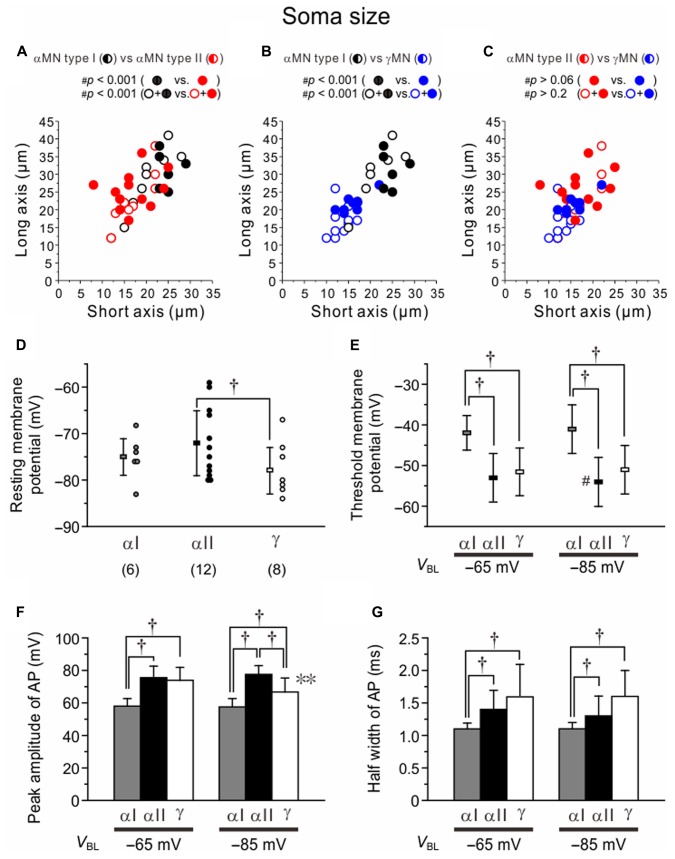
FIGURE 8.
Differences in the soma size and electrophysiological property among Type I and II αMNs and γMNs. (A–C) Differences in the distribution profiles of short and long axis sizes of somata in the two-dimensional space between Type I and II αMNs (A), between Type I αMNs and γMNs (B), and between Type II αMNs and γMNs (C). Black, red, and blue filled circles represent Type I and Type II αMNs and γMNs, respectively, which were classified both electrophysiologically and immunohistochemically. Black, red, and blue open circles represent Type I and Type II αMNs and γMNs, respectively, which were classified only electrophysiologically. Half-filled circles represent both filled and open circles of the same color. (D) The resting membrane potentials in Type I and II αMNs and γMNs. †p < 0.05. (E) The threshold membrane potentials of spikes evoked at –65 and –85 mV in Type I and II αMNs and γMNs. †p < 0.02. (F) The peak amplitudes of action potentials evoked at –65 and –85 mV in Type I and II αMNs and γMNs. †p < 0.05. ∗∗p < 0.05. (G) The half-width values of action potentials evoked at –65 and –85 mV in Type I and II αMNs and γMNs. †p < 0.03.

