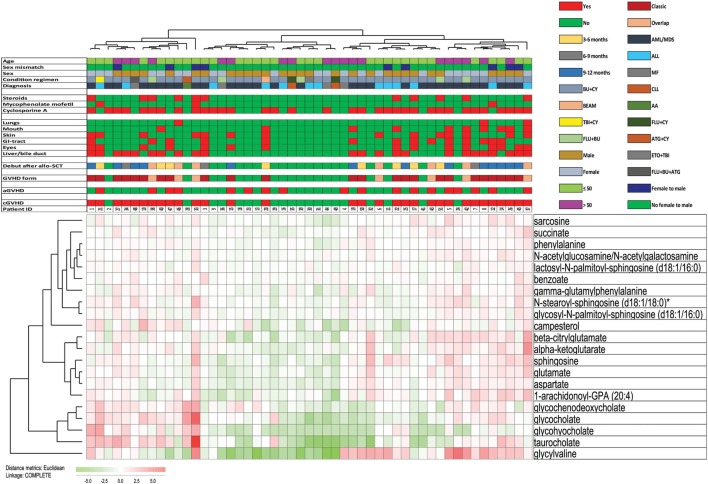
Figure 9.
Hierarchical clustering analysis including all 51 patients and based on 21 selected metabolites. The analysis was based on the 30 top-ranked metabolites identified by the random forest analysis of the overall metabolic profile of all 51 patients and comparing patients with and without chronic graft versus host disease (cGVHD) (see Figure 2), but 9 of these 30 metabolites were excluded from this analysis because they overlapped with the 30 top-ranked metabolites identified by the comparison of patients with/without cyclosporine treatment (Figure 8) or with/without systemic steroid treatment (Figure 7). Based on the 21 remaining metabolites we performed a hierarchical clustering analysis (Euclidian Correlation, complete linkage). The heat map and corresponding dendrograms are shown in the figure together with the clinical characteristics of individual patients (see horizontal bars in the upper part). The metabolites are listed to the right in the figure; red color means high metabolite levels and green color low levels as indicated to the lower left in the figure. The clinical characteristics of each individual patient are presented in the upper part of the figure; for the lower horizontal bars the presence of a factor is indicated by red and the absence by green, whereas the color codes for the upper horizontal bars are explained in the figure.

