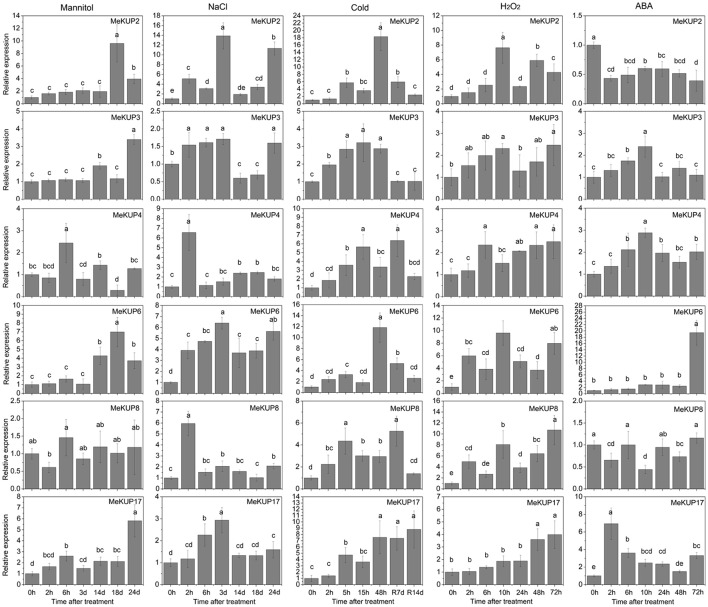
Figure 6.
Expression patterns of MeKUPs after osmotic, NaCl, cold, H2O2, and ABA treatments treatment in cassava. The mean fold changes of each gene between treated and control samples at each time point were used to calculate its relative expression levels. NTC indicates no treatment controls (mean value = 1). Data are means ± SD of n = 3 biological replicates. Means denoted by the same letter do not significantly differ at P < 0.05 as determined by Duncan's multiple range test.

