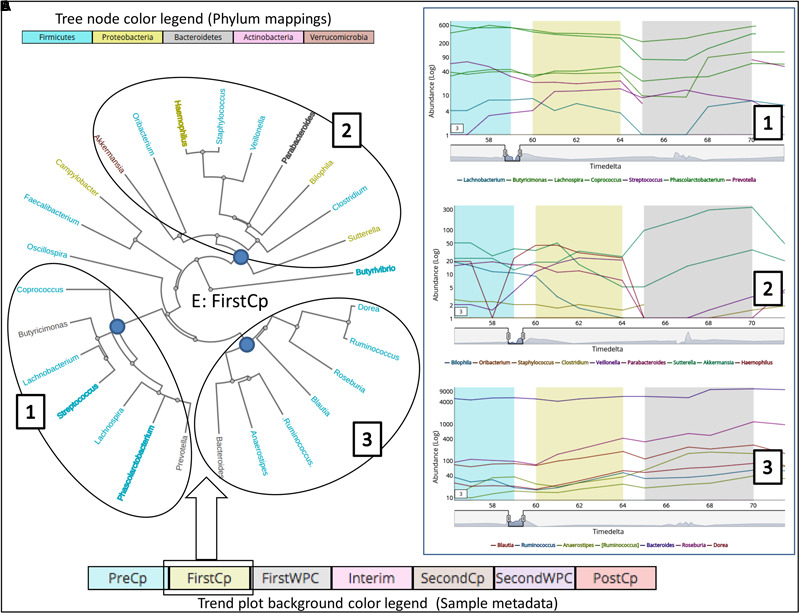
FIGURE 3.

Clustering of taxonomic groups based on their temporal trends during the antibiotic treatment (‘FirstCp’ of ‘Dethlefsen-Dataset’ used in the case study) on Subject ‘E.’ The (A) shows a tree (radial layout) with three clusters generated using DTW-distance metric in ‘Workflow-5a.’ The (B) shows the corresponding trend plots for the three clusters obtained by clicking on the root node of each cluster. The genera color labels (in the tree) correspond to their respective phyla as shown in the legend while bold labels indicate non-stationary taxa.
