
FIGURE 4.
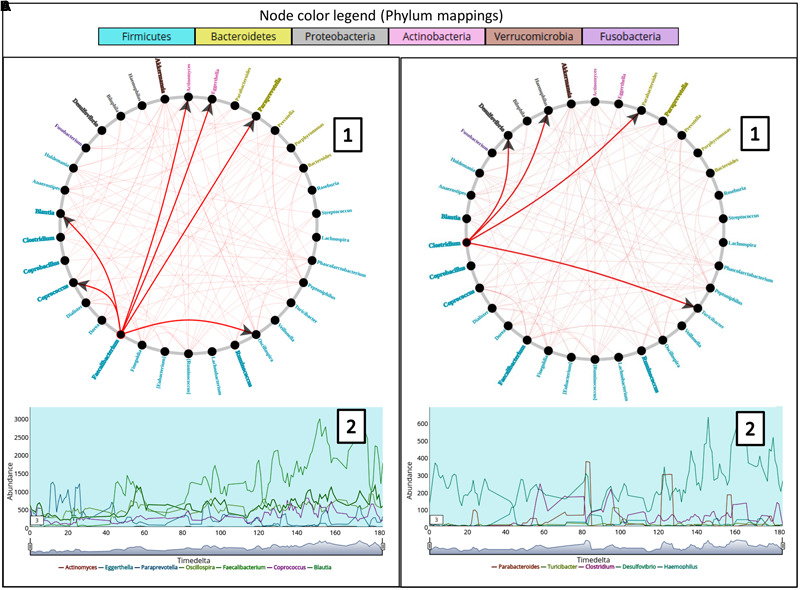
(A,B) Represent two composite plots for Granger causality graphs (A1 and B1) and Trend plots (A2 and B2) corresponding to genera Faecalibacterium and Clostridium respectively. Granger causality graph (A1 and B1) for the constituent taxa in the female subject of ‘Caporaso-Dataset’ used in the case study generated using ‘Workflow-6.’ The trend plots (A2 and B2) for two genera namely Faecalibacterium and Clostridium along with the genera caused (or affected) by them are displayed below the corresponding circular graphs. The arrows in the graph represent the causality relationships between the source and target nodes. The genera color labels correspond to their respective phyla as shown in the legend while bold labels indicate non-stationary taxa.