
FIGURE 6.
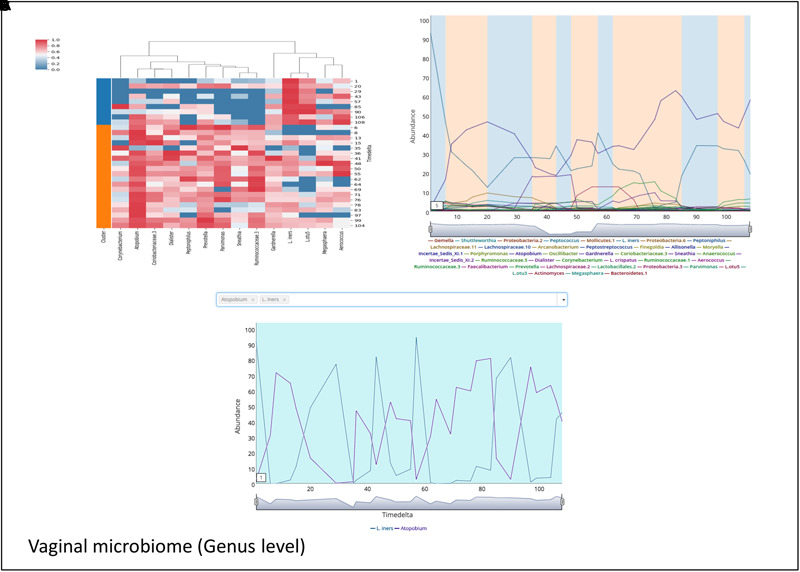
Demonstrating the periodic microbial community patterns in the vaginal microbiome of ‘Gajer-Dataset’ used in the case study. (A) Heatmap clustered vertically based on taxa abundance and horizontally arranged based on the two community clusters (represented as ‘Cluster 1’ and ‘Cluster 2’) identified by TIME. (B) Trend plots of the constituent taxa with the plot background highlighted corresponding to the ‘community state’ affiliation (in ‘blue’ and ‘orange’) of the respective time points. (C) Demonstrating the antagonistic behavior between the two genera Lactobacillus iners and Atopobium in the vaginal microbiome dataset used in the case study generated using ‘Workflow-2.’