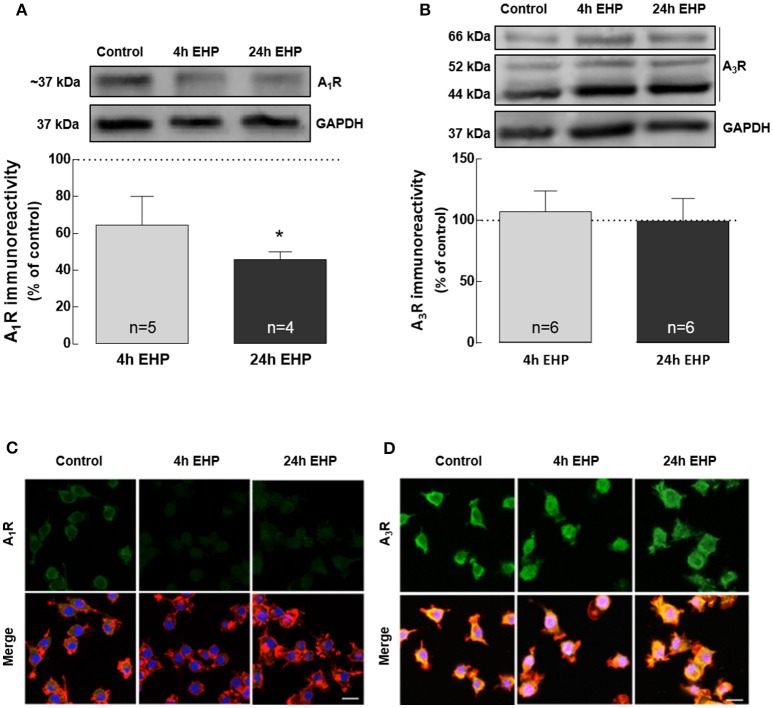
Figure 5.
Elevated hydrostatic pressure changes the expression and density of A1R but not A3R. Total BV-2 cell extracts were assayed for A1R (A) and A3R (B) by Western blot. Representative images for A1R, A3R and GAPDH (loading control) are presented above the graphs. Results are expressed as percentage of control. Cells were immunolabelled with anti-A1R (green) (C) or anti-A3R (green) (D) antibodies. Phalloidin (red) staining was used to visualize cells. Nuclei were counterstained with DAPI (blue). Scale bar: 20 μm. *p < 0.05, different from control; Kruskal-Wallis test, followed by Dunn's multiple comparison test.

