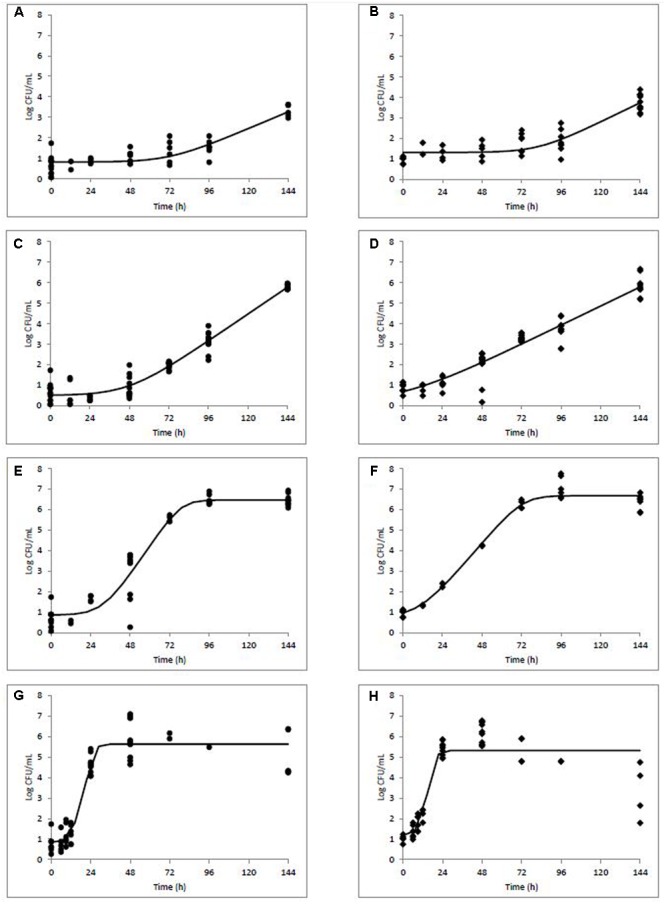
FIGURE 2.

Modeled growth of L. monocytogenes in milkshakes made from naturally and artificially contaminated ice cream stored at 5 (A,B), 10 (C,D), 15 (E,F), or 25°C (G,H) for 144 h. Data points represent CFU per mL of milkshake. Line represents modeled growth. Circles (A,C,E,G) are naturally contaminated and diamonds (B,D,F,H) are artificially contaminated L. monocytogenes populations.
