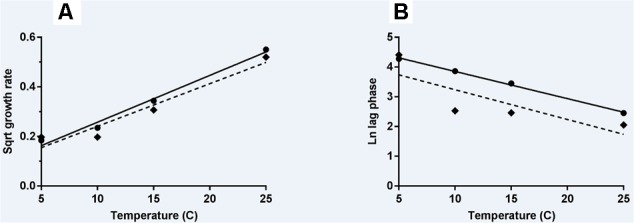
FIGURE 4.

Secondary models of relationship of temperature with growth rate (A) and lag phase duration (B) of L. monocytogenes. Solid line and circles represent naturally contaminated model and observed values, respectively. Dashed line and diamonds represent artificially contaminated model and observed values, respectively.
