Figure 6.
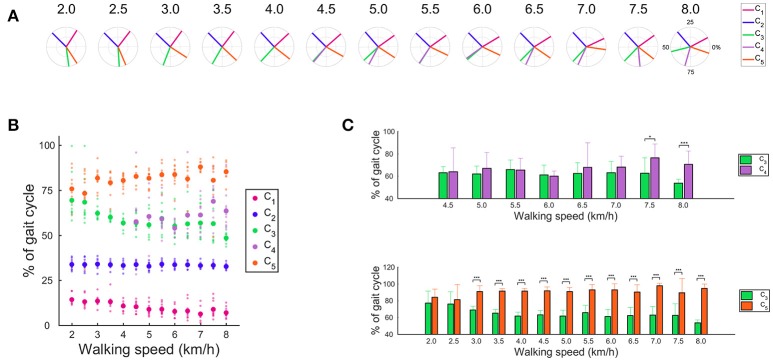
The CoAs in the muscle synergy. (A) Averaged CoA among subjects across walking speeds. Averaged CoA located in the polar coordinate, and the polar direction denotes the relative time over the gait cycle (time progresses counter-clockwise). (B) Averaged CoA and all subjects' CoA across walking speed conditions. Large dots denote the averaged CoA, and small dots indicate the CoA of each subject. (C) Difference in the CoA at each walking speed condition. Difference in the CoA between the C3 and C4 (upper) and between the C3 and C5 (below). Significance levels are illustrated as asterisks (*p < 0.05, ***p < 0.01).

