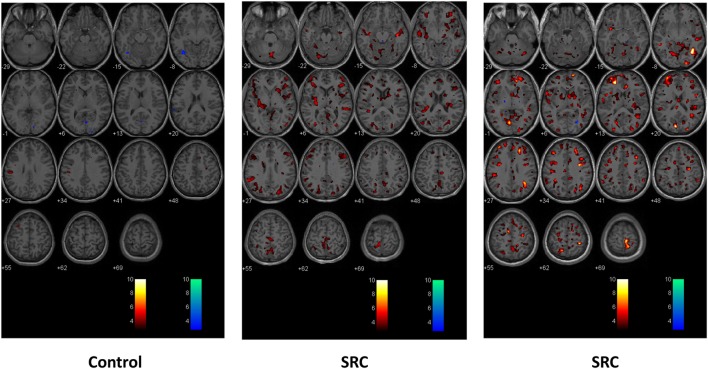
Figure 2.
Second-level comparisons of one individual control subject (left panel) and two sports-related concussion (SRC) patients (middle and right panel) against the normal control atlas. Examined at the p = 0.005 level. Global and regional significant differences in voxel-by-voxel responses that were greater than and less than the mean healthy control atlas response are indicated in color. Hot scale t-statistic level (orange hues) indicates where the individual subject had a greater response to the CO2 stimulus when compared to the control group; cold scale t-statistic level (blue hues) indicates where the individual subject had a diminished response to the CO2 stimulus compared to the control group.

