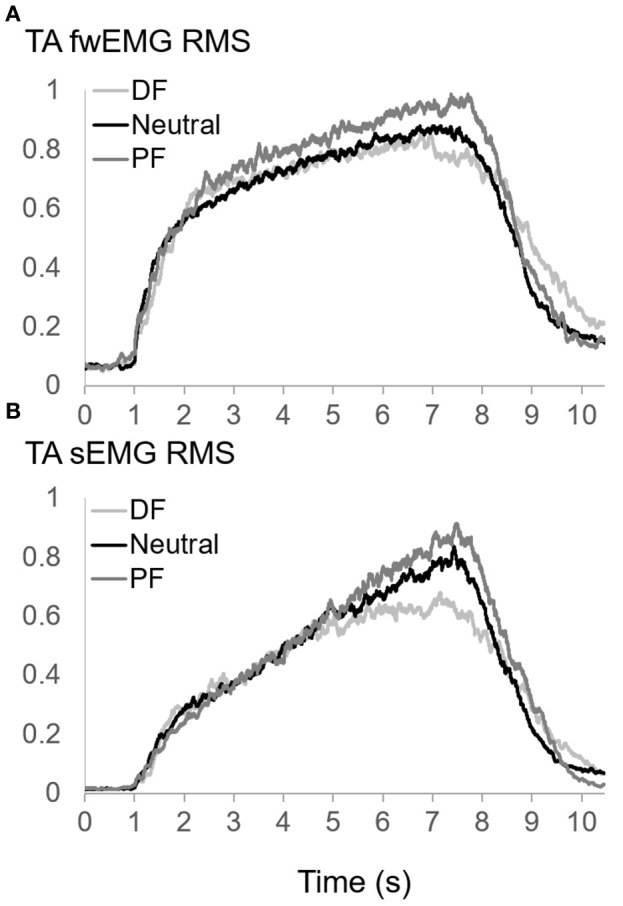
Figure 4.

(A) Fine-wire EMG (fwEMG) root-mean-square (RMS), and (B) surface EMG (sEMG) RMS of TA during isometric ramp contractions up to 80% MVC at dorsiflexion (DF), neutral (Neutral), and plantarflexion (PF) positions of ankle. Raw fw- and sEMG signals were full-wave rectified. sEMG was filtered with a dual-pass 10–500 Hz 4th-order band pass Butterworth filter whereas fwEMG was filtered with a dual-pass 10–1500 Hz 4th-order band pass Butterworth filter. EMG RMS was calculated using a 250-point moving average window. RMS values of each trial normalized to the peak RMS values calculated from MVC values at each position. Three trials of each participant were averaged point by point and averages of all participants were calculated and plotted for each position.
