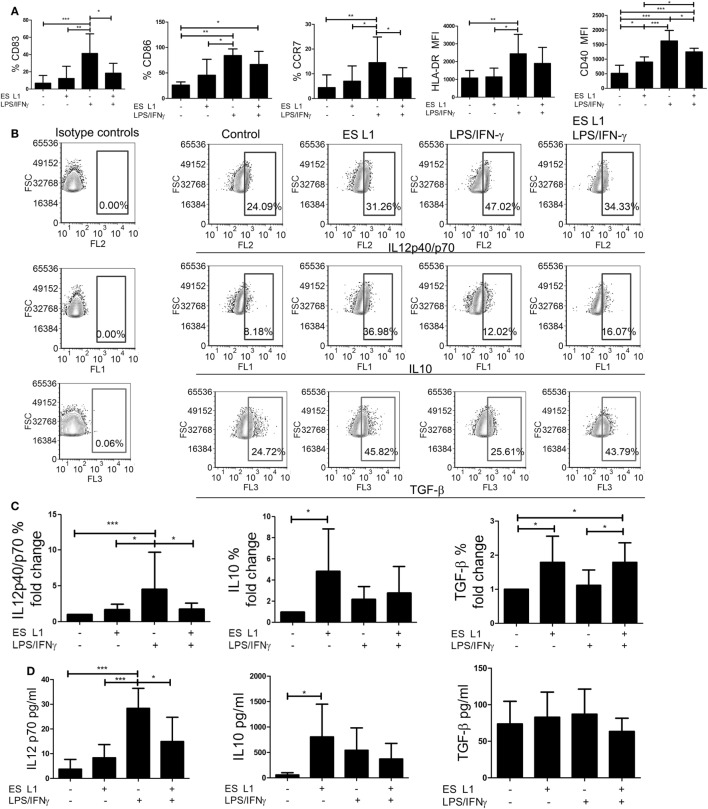
Figure 2.
The maturation capacity of dendritic cells (DCs) treated with ES L1 antigens. (A–D) Immature DCs were treated with ES L1 antigens (50 µg/ml) on Day 4 of culture for 24 h and then additionally activated or not with LPS/interferon (IFN)-γ for the next 24 h, followed by flow cytometry analysis. (A) The percentages of CD83, CD86, HLA-DR, CCR7, and CD40 expression by DCs are shown as mean ± SD from four different experiments (see also Figure S2 in Supplementary Material for a representative experiment). (B) Representative analysis of interleukin (IL)-10, IL12p40/p70, and transforming growth factor (TGF)-β expression within DCs are shown, and (C) the summarized results are presented as fold change of cytokines expression as mean ± SD from seven different experiments. (D) The levels of IL-10, IL-12p70, and TGF-β (picograms/milliliter) in DCs culture supernatants were measured by ELISA test. *p < 0.05, **p < 0.01, ***p < 0.005 compared to control, or as indicated (one-way ANOVA with Tukey’s posttest).

