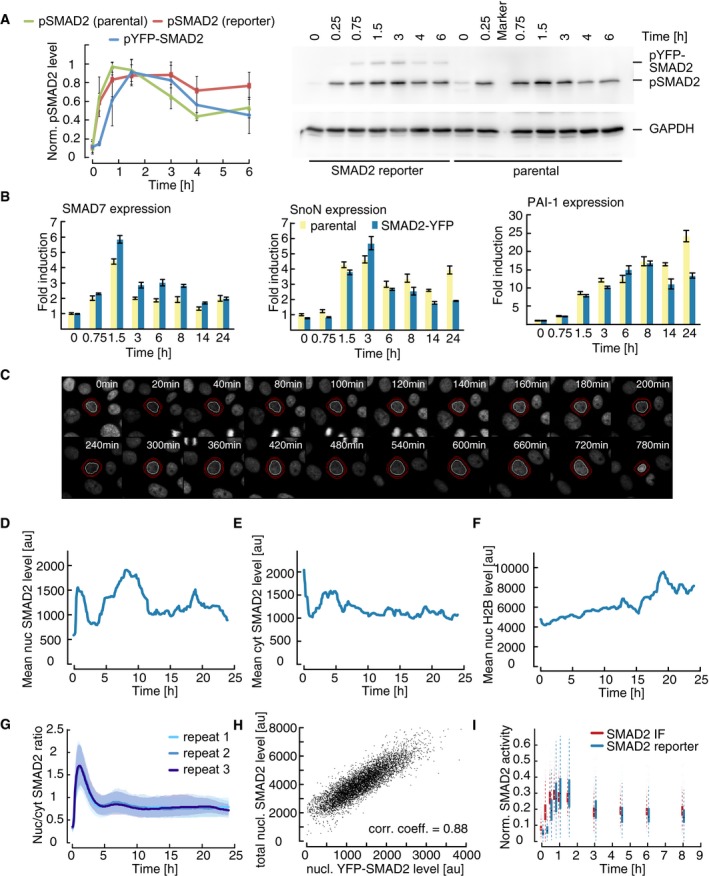
Figure EV1. Dynamics and variability of SMAD2 signaling in single cells.

-
AWestern blot analysis of SMAD2 activation in SMAD2‐YFP reporter and parental MCF10A cells. Cells were stimulated with 100 pM TGFβ1 and SMAD2 phosphorylation was analyzed at indicated time points. GAPDH was used as a loading control. Independent experiments were quantified and normalized to maximum values. Error bars indicate standard deviation of biological repeats (n = 4). Note that phosphorylated YFP‐SMAD2 was at background levels at 0.25 h presumably due to lower expression levels.
-
BExpression of SMAD target genes in parental and SMAD2 reporter cell lines. Expression kinetics of the SMAD target genes SMAD7, SnoN, and PAI‐1 upon 100 pM TGFβ stimulation were measured by qPCR in the indicated cell lines. β‐Actin was used as an internal control. Error bars indicate standard deviation of technical triplicates.
-
CLive‐cell time‐lapse microscopy images of H2B‐CFP expression in MCF10A cells following treatment with 100 pM TGFβ. The same detail as in Fig 1D is shown. White circle indicates the segmented nucleus, and the estimated cytoplasmic area is represented by red annuli.
-
D–FThe cell indicated in Fig 1D was tracked over 24 h. The mean nuclear (D) and cytoplasmic (E) fluorescence intensity of SMAD2‐YFP as well as the nuclear fluorescence intensity of H2B‐CFP (F) were measured upon 100 pM TGFβ stimulation.
-
GReproducibility of SMAD2 translocation measurements. Median SMAD2‐YFP ratios (solid lines) of cells plated in three independent glass bottom plates stimulated with 100 pM TGFβ at the same day and tracked over 24 h (biological triplicates). Shaded areas indicate 25th and 75th percentiles. See Appendix Table S1 for number of cells analyzed.
-
HCorrelation between endogenously expressed SMAD2 and transgenic YFP‐SMAD2. In the same individual SMAD2 reporter cells treated with 100 pM TGFβ for 1.5 h, nuclear endogenous SMAD2 was measured by immunofluorescence and compared to the nuclear fluorescence intensity from YFP‐SMAD2. Both measures were highly correlated (Pearson's correlation, n = 7,300).
-
IComparison of endogenous SMAD2 activation and SMAD2‐YFP translocation. The nuc/cyt ratio of SMAD2‐YFP upon 100 pM TGFβ stimulation was measured in reporter cells by time‐lapse microscopy at the indicated time points (blue); phosphorylation of endogenous SMAD2 was measured in parental MCF10A cells by immunofluorescence (IF, red) under the same conditions. Data were normalized by minimum subtraction and division through the overall maximum. White and black dots indicate medians; boxes include data between the 25th and 75th percentiles; whiskers extend to maximum values within 1.5× the interquartile range; colored dots represent outliers. See Appendix Table S1 for number of cells analyzed.
