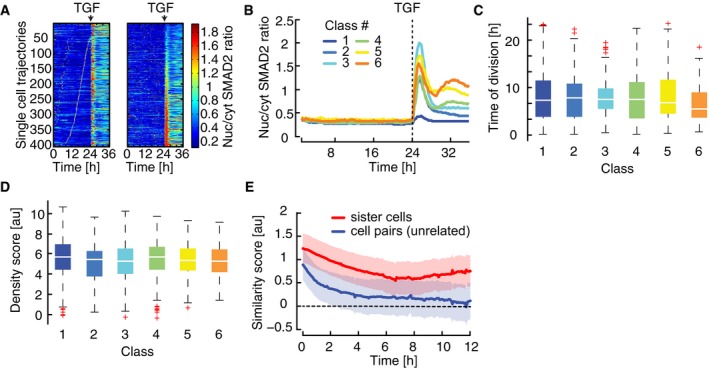
Figure 3. Heterogeneity in SMAD dynamics determined by cellular state.

- Heat map of SMAD2 translocation in individual cells over time. Cells were imaged for 24 h before stimulation with 100 pM TGFβ1. Each horizontal line represents a single cell, and the nuc/cyt ratio is shown as indicated in the legend. Time of cell division is indicated by white marks. Cells were sorted either by the time of the last division before stimulation (left) or by the amplitude of their response (right). Cell cycle and response are not correlated. See Appendix Table S1 for number of cells analyzed.
- Mapping of SMAD2 translocation dynamics in individual cells to previously identified signaling classes (compare Fig 2C). Cells were imaged for 24 h before stimulation with varying TGFβ1 concentrations (Fig EV3A). For each trajectory, the most similar signaling class was determined using Euclidian distance to the median dynamics of the previously defined clusters (Fig 2C) as a similarity measure. Median nuc/cyt SMAD2 ratios for resulting mapped subpopulations are shown. See Appendix Table S1 for number of cells analyzed.
- Time of last cell division before stimulus for each signaling class (defined in B). Distributions are overlapping; no significant trend in cell division time is observable. White lines indicate median; boxes include data between the 25th and 75th percentiles; whiskers extend to maximum values within 1.5× the interquartile range; crosses represent outliers. See Appendix Table S1 for number of cells analyzed.
- Cell density before stimulus for each signaling class (defined in B). Density scores represent a weighted sum of all neighboring cells within 640 μm distance. Distributions are overlapping; no significant trend in cell density is observable. White lines indicate median; boxes include data between the 25th and 75th percentiles; whiskers extend to maximum values within 1.5× the interquartile range; crosses represent outliers. See Appendix Table S1 for number of cells analyzed.
- Analysis of SMAD2 translocation dynamics in sister cells. SMAD2 translocation dynamics in sister cells after division and unrelated cell pairs with the same nuc/cyt SMAD2 ratio were compared using cDTW. Resulting similarity scores were aligned in time and compared to those from randomly selected cell pairs. Effect size (solid lines) and 95% confidence intervals (shaded areas) were estimated by bootstrapping. The analysis shows that recently divided cells are more similar than control cell pairs and remain correlated over time, indicating that heterogeneity arises from differences in cellular state. See Appendix Table S1 for number of cells analyzed.
