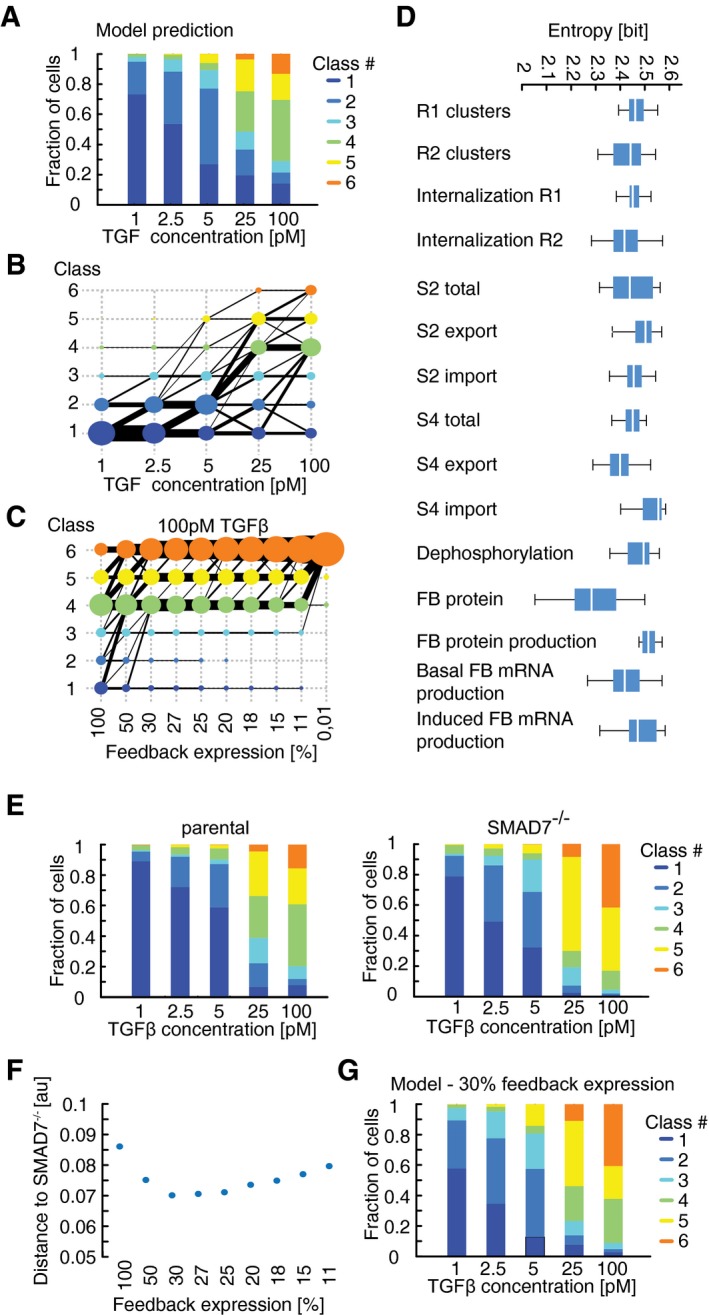
Figure 6. Negative feedback determines decomposition into signaling classes.

- Predicted distributions of signaling classes depending on TGFβ dose. Simulations were performed as described for Fig 5E. The simulated time courses were mapped onto the original clusters dynamics (Fig 2C) as described in Appendix II.H.
- Transition between signaling classes depending on stimulus strength. Same data as in (A). Black lines and their thickness indicate the direction and extent of transitions between signaling classes. Filled circle size indicates the proportion of artificial cells in the corresponding signaling class.
- Transition between signaling classes depending on feedback strength. The response of a reassembled population of artificial cells to 100 pM TGFβ1 was simulated with reduced feedback expression as indicated (see Appendix IV.D) and mapped to previously observed signaling classes. Black lines and their thickness indicate the direction and extent of transitions between signaling classes. Transitions with a probability below 1% were excluded for better visualization.
- Variation of model parameters across signaling classes. For 30 independent model fits to the experimentally observed signaling classes upon stimulation with 100 pM TGFβ1 (see Appendix), the variation of the indicated parameters between signaling classes was calculated as entropy. Lower entropies indicate more variation between signaling classes; uniform parameter distribution would lead to the maximal entropy of 2.6 bits. White lines indicate median; boxes include data between the 25th and 75th percentiles; whiskers extend to maximum values within 1.5× the interquartile range.
- Distribution of signaling classes in parental and SMAD7 knock‐out cells. Cells were stimulated with indicated concentrations of TGFβ and measured SMAD2 translocation dynamics mapped to the previously observed signaling classes (Fig 2C).
- Calibration of feedback level. Signaling class distributions at varying levels of feedback expression (C) were compared to experimentally observed distribution upon SMAD7 knock‐out (E). Minimal divergence between model and data was observed at 30% feedback expression.
- Predicted distributions of signaling classes depending on TGFβ dose at 30% feedback expression. Simulations were mapped to the previously observed signaling classes (Fig 2C)
