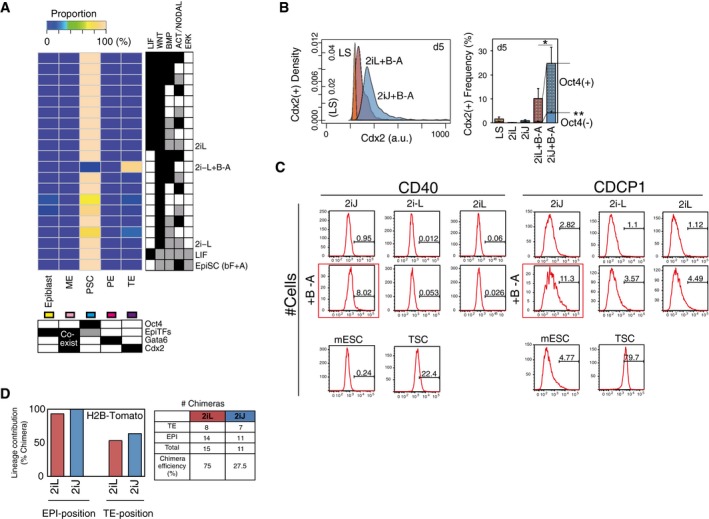
Figure EV5. In silico subpopulation analysis reveals mESCs exit pluripotency toward TE‐like lineage in 2iJ+B−A condition; related to Fig 5 .

- In silico subpopulation analysis of possible signaling input combinations with 2iL and 2i−L. The threshold values for predicted expression levels of lineage specifiers in each SCC are set as follows: Oct4 = 0.3, EpiTFs = 0.2, and Gata6 = 0.5 and Cdx2 = 0.7.
- Frequency of Cdx2+ population including TE‐like subpopulation (Cdx2+/Oct4−) after 5 days in culture measured by immunostaining. Data represent the means and the error bars represent s.d. of six replicates consisting of two biological replicates with three technical replicates in each. The representative density plot of immunostaining of Cdx2 on day 5 is shown in the left panel. The significance was assessed by Wilcoxon exact rank test (*P < 0.05, **P < 0.0005) for the frequencies of total Cdx2+ and Cdx2+Oct4− comparing 2iL+B−A and 2iJ+B−A.
- Histograms for expression of TE‐enriched cell surface markers, CD40 and CDCP1. Shown are mESCs treated in 2iJ (1st column), 2i−L (2nd column), or 2iL (3rd column), in unsupplemented medium (1st row) or BMP4 and ALKi supplemented medium (+B−A; 2nd row). Control mESCs (kept in control LS) and TSCs are shown at the bottom.
- In vivo lineage contribution frequency and chimera efficiency of H2B‐Tomato ESCs (Morgani et al, 2013) treated with either 2iL or 2iJ in the presence of serum.
Source data are available online for this figure.
