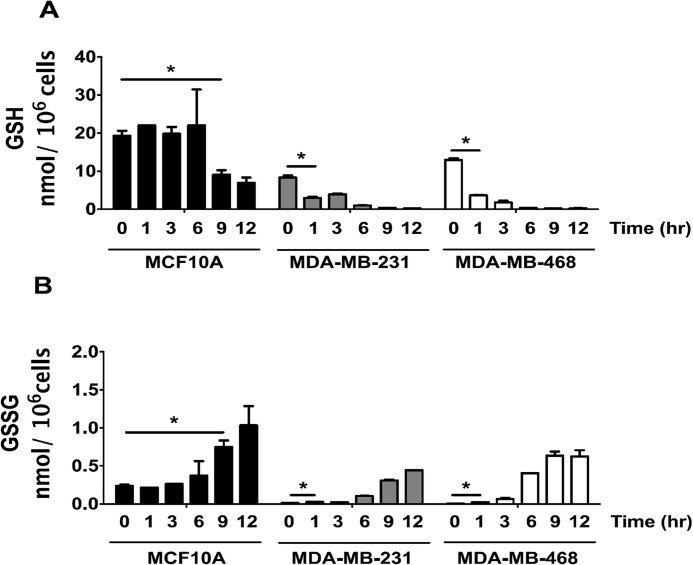
Figure 4.
NO2-OA depletes GSH levels and enhances GSSG formation in TNBC cells. The response of cellular GSH (A) and GSSG (B) to NO2-OA in MCF-10A (black bars), MDA-MB-231 (gray bars), and MDA-MB-468 (white bars) cells is shown. Cells were treated with NO2-OA (5 μm) for the indicated times (h). GSH and GSSG were extracted from cells (3 × 10⁶ cells/ml) and quantitated by LC-MS/MS. *, p < 0.05 versus 0 h via unpaired two-tailed Student's t test. Data are presented as mean ± S.D. (error bars) (n = 5).

