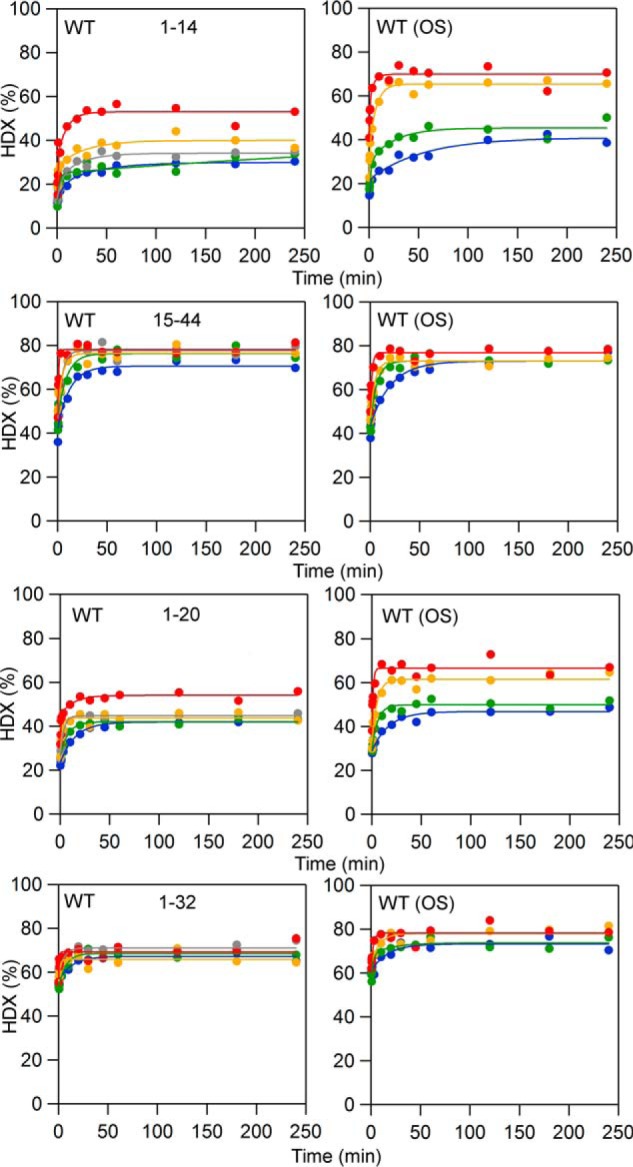
Figure 4.

HDXMS traces showing peptides that exhibit increased extent of exchange at longer time points in the presence of OS. Blue, 10 °C; green, 20 °C; yellow, 30 °C; red, 40 °C. The data are shown in dots; the fits to the data are solid lines.

HDXMS traces showing peptides that exhibit increased extent of exchange at longer time points in the presence of OS. Blue, 10 °C; green, 20 °C; yellow, 30 °C; red, 40 °C. The data are shown in dots; the fits to the data are solid lines.