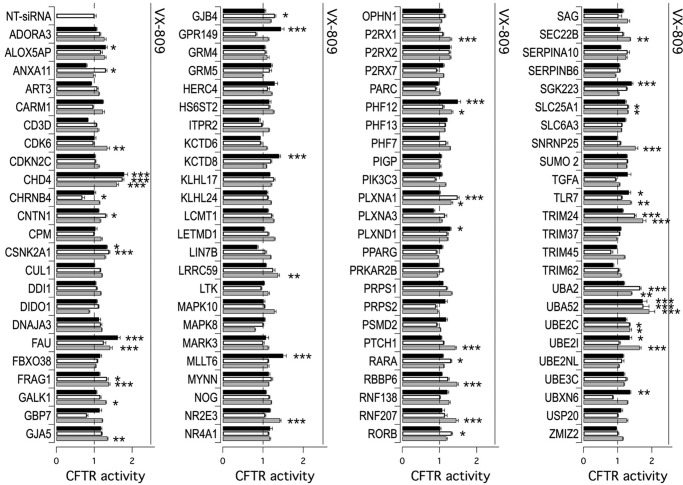
Figure 2.
Validation of putative hits derived from primary screening. The bar graph shows F508del-CFTR activity in CFBE41o− cells based on the YFP assay. The cells were previously transfected with siRNAs (final concentration, 30 nm) against indicated targets (three siRNAs molecules per gene, corresponding to black, white, and gray bars) or with control, NT-siRNA. The assay was carried out 48 h after transfection. The activity measured upon treatments was normalized for the activity detected under control condition (NT-siRNA + DMSO). For each gene, the cells transfected with NT-siRNAs were also treated separately with VX-809 corrector (1 μm) for 24 h. The extent of rescue obtained with VX-809 is indicated by a solid line above each set of bars. The data are expressed as means ± S.E. (n = 8). Statistical significance was tested by parametric ANOVA followed by the Dunnet multiple comparisons test (all groups against the control group). Asterisks indicate statistical significance versus NT-siRNA: ***, p < 0.001; **, p < 0.01; and *, p < 0.05.

