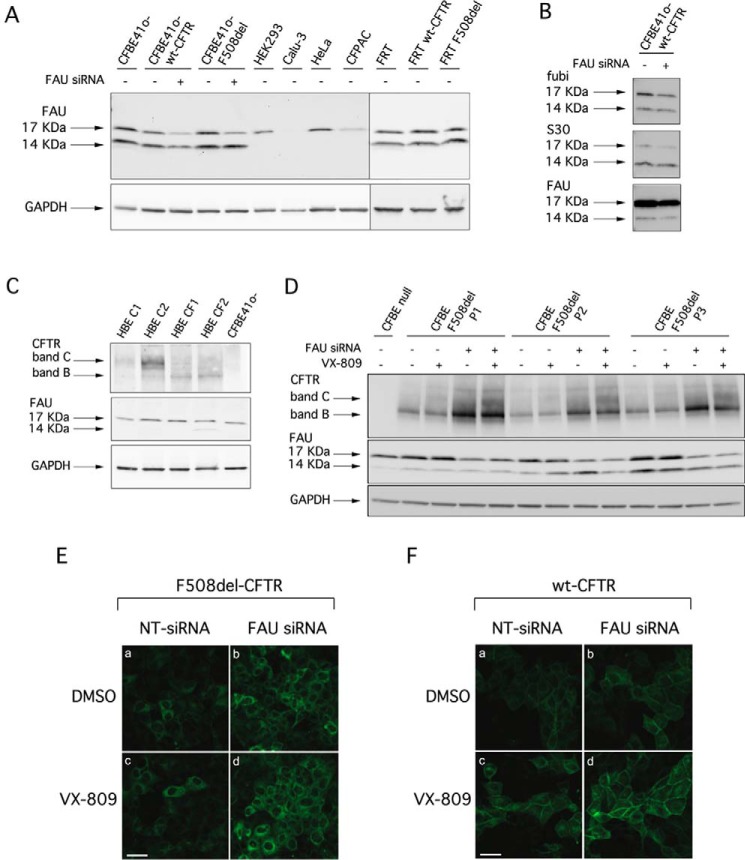
Figure 4.
Analysis of FAU expression and effect of FAU knockdown on CFTR expression. A, biochemical analysis of FAU expression pattern. The pictures show the electrophoretic mobility of FAU in different cell lines, under control condition or, where indicated, following transfection with anti-FAU siRNA (final concentration, 30 nm). B, immunodetection of FAU protein by Western blotting using three different antibodies targeting different domains of the protein. C, biochemical analysis of CFTR and FAU expression pattern in lysates of primary bronchial epithelial cells from healthy donors or CF patients homozygous for the F508del mutation. D, electrophoretic mobility of F508del-CFTR in three different preparations of CFBE41o− cells after transfection with anti-FAU siRNA (final concentration, 30 nm) alone or in combination with VX-809 (1 μm) treatment. E, confocal microscopy images showing immunolocalization of F508del-CFTR protein in CFBE41o− cells after transfection with indicated siRNAs (final concentration, 30 nm) and treatment with DMSO alone or with VX-809 (1 μm). F, confocal microscopy images showing immunolocalization of wt-CFTR protein in CFBE41o− cells after transfection with indicated siRNAs (final concentration, 30 nm) and treatment with DMSO alone or with VX-809 (1 μm). Scale bars, 30 μm.

