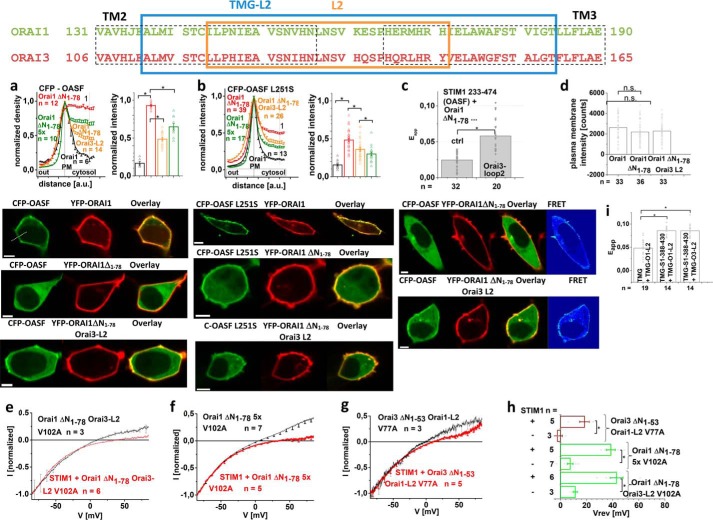
Figure 3.
Functional Orai1 ΔN1–78 Orai3-loop2 chimera displays recovered coupling to STIM1. Top, sequence alignment of Orai1- and Orai3-loop2 depicting loop2 fragment used in the chimeras (framed in orange) and the one attached to TMG used for FIRE measurements (framed in blue). a and b, intensity plots representing the localization of STIM1 233–474 (a) and STIM1 233–474 L251S (b) across the cell when co-expressed with Orai1, Orai1 ΔN1–78, Orai1 ΔN1–78 Orai3-loop2, and Orai1 ΔN1–78 5× together with bar graphs exhibiting normalized intensities at point 1. Image series depict CFP-OASF/-OASF L251S and YFP-Orai1, -Orai1 ΔN1–78, or -Orai1 ΔN1–78 Orai3-L2 and overlay. c, bar graph depicting FRET of STIM1 233–474 with Orai1 ΔN1–78 and Orai1 ΔN1–78 Orai3-loop2. Image series depict CFP-OASF and YFP-Orai1, -Orai1 ΔN1–78, or Orai1 ΔN1–78 Orai3-L2, overlay, and pixelwise calculated NFRET index for a representative cell. Yellow arrows, plasma membrane localization. d, block diagram exhibiting the mean plasma membrane intensities of Orai1, Orai1 ΔN1–78, and Orai1 ΔN1–78 Orai3-loop2 in comparison. e, I/V relationship of normalized Orai1 ΔN1–78 Orai3-loop2 V102A with and without STIM1. f, I/V relationships of normalized Orai1 ΔN1–78 5× V102A with and without STIM1. g, I/V relationships of normalized Orai3 ΔN1–53 Orai1-loop2 V77A with and without STIM1. h, block diagram displaying the reversal potentials of Orai1 ΔN1–78 Orai3-loop2 V102A, Orai1 ΔN1–78 5× V102A, and Orai3 ΔN1–53 Orai1-loop2 V77A currents in the absence compared with the presence of STIM1. i, bar graph depicting FRET of fluorescently labeled CFP-TMG-STIM1 388–430 with YFP-TMG-Orai1-loop2 or YFP-TMG-Orai3-loop2 in comparison with CFP-TMG with YFP-TMG-Orai1-loop2. Error bars, S.E.; *, p < 0.05; n.s., not significant.

