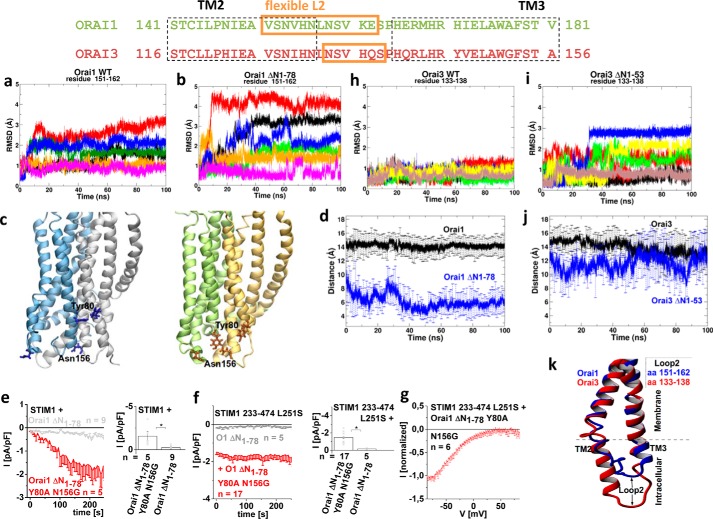
Figure 6.
Orai1 ΔN1–78 loses function due to an inhibitory interaction of Orai1-loop2 and the N terminus. a and b, RMSD of flexible loop2-portion (aa 151–162) in Orai1 wildtype and Orai1 ΔN1–78 truncation mutant. RMSDs of different monomers (in total 6) are shown in different colors. c, side view of Orai1 full-length (left; two monomers are shown in different colors, and Tyr80 and Asn156 residues are shown as blue sticks) and Orai1 ΔN1–78 truncation mutant (right; two monomers are shown in different colors, and Tyr80 and Asn156 residues are shown orange sticks), showing interactions between loop2 and the N terminus of TM1. d, distance plot for Tyr80 (NT)–Asn156 (loop2) in Orai1 WT and ΔN1–78 truncation mutants calculated and averaged over all six monomers (p < 0.001 at t = 100 ns). e, time course of whole-cell inward currents at −74 mV activated by passive store depletion of HEK 293 cells co-expressing STIM1 + Orai1 ΔN1–78 Y80A N156G in comparison with STIM1 + Orai1 ΔN1–78 together with a block diagram showing maximum currents at t = 180 s. f, time course of whole-cell inward currents at −74 mV activated by passive store depletion of HEK 293 cells co-expressing STIM1 233–474 L251S + Orai1 ΔN1–78 Y80A/N156G in comparison with STIM1 233–474 L251S + Orai1 ΔN1–78 together with a block diagram showing maximum currents at t = 180 s (*, p < 0.05). g, I/V relationship of STIM1 233–474 L251S-mediated Orai1 ΔN1–78 Y80A/N156G currents. h and i, RMSD of flexible loop2 (aa 133–138) in Orai3 wildtype and Orai3 ΔN1–53 truncation mutant. RMSD of different monomers (in total 6) are shown in different colors. j, distance plot for Tyr55 (TM1)–Asn131 (loop2) in Orai3 WT and ΔN1–53 truncation mutants calculated and averaged over all six monomers. (p > 0.05 at t = 100 ns). k, comparison of side views of Orai1 (blue) and Orai3 (red) of TM2 and TM3 connecting the flexible loop2 portion in between after simulation of the human Orai1 and Orai3 models. On average, TM2 of Orai1 is shorter than that of Orai3. *, p < 0.05. Error bars, S.E.

