Figure 1.
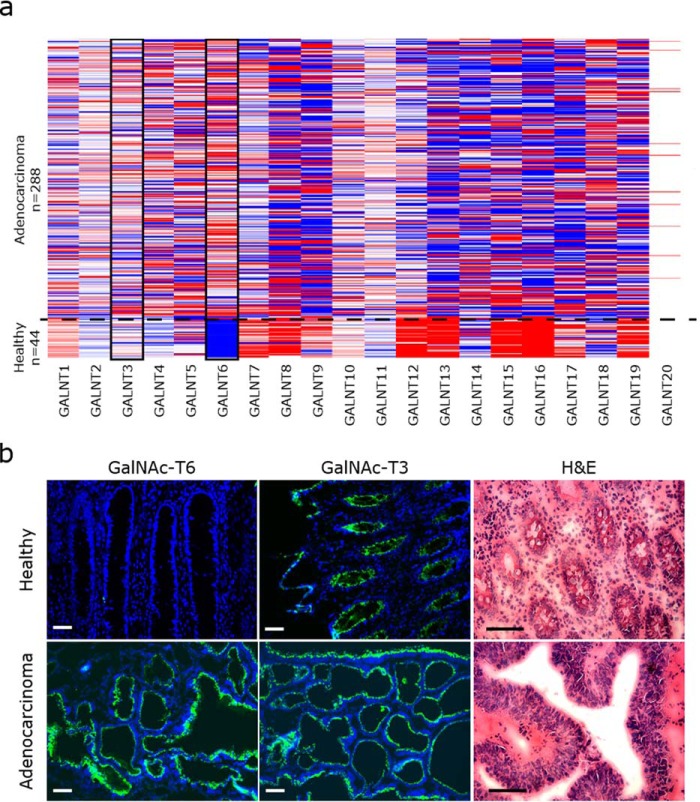
Expression pattern of GalNAc-T6 and GalNAc-T3 in colon tissue. a, TCGA IlluminaHiSeq RNAseq data obtained from https://genome-cancer.ucsc.edu/proj/site/hgHeatmap3 show the expression of GalNAc-Ts in 288 colon adenocarcinomas and 44 healthy colon tissue samples. Red >0, white = 0, blue <0, gray = no data. The data are normalized by subtracting the mean of the RNAseq values from each sample value for each of the 20 GalNAc-T and shown in red or blue color. GalNAc-T6 is specifically up-regulated in colon adenocarcinoma, whereas GalNAc-T3 expression is unchanged. b, immunofluorescence staining of GalNAc-T6 (mAb 2F3) and GalNAc-T3 (mAb 2D10) (green) in colorectal adenocarcinoma and healthy colon mucosa (blue, DAPI). GalNAc-T6 is strongly expressed in tumor tissue and absent in normal tissue, whereas GalNAc-T3 is expressed in both types of tissue. Hematoxylin and eosin (H&E) staining shows the morphology of tumor tissue compared with normal tissue in the present sample. Scale bar, 50 μm.

