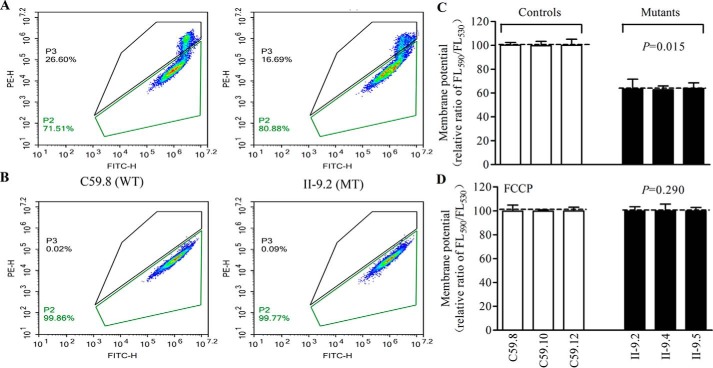
Figure 10.
Mitochondrial membrane potential analysis. ΔΨm was measured in three mutant and three control cell lines using a fluorescence probe JC-10 assay system. The ratio of fluorescence intensities excitation/emission = 490/590 and 490/530 nm (FL590/FL530) were recorded to delineate the ΔΨm level of each sample. Represented flow cytometry images of cell lines II-9.2 and C59.8 with (A) and without (B) 10 μm FCCP. Relative ratio of JC-10 fluorescence intensities at excitation/emission = 490/530 and 490/590 nm in the absence (C) and presence (D) of 10 μm FCCP. The average of three to five determinations for each cell line are shown. Graph details and symbols are explained in the legend to Fig. 4.

