Figure 4.
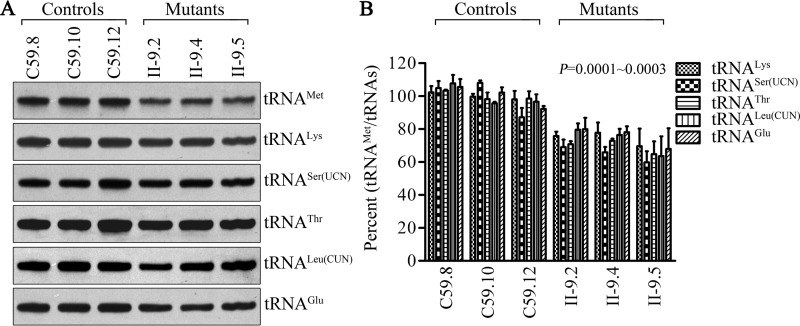
Northern blot analysis of tRNA under a denaturing condition. A, 2 μg of total mitochondrial RNA from various cell lines were electrophoresed through a denaturing polyacrylamide gel, electroblotted, and hybridized with DIG-labeled oligonucleotide probes specific for the tRNAMet, tRNALys, tRNASer(UCN), tRNAThr, tRNALeu(CUN), and tRNAGlu, respectively. B, quantification of tRNA levels. Average relative tRNAMet content per cell, normalized to the average content per cell of tRNALys, tRNASer(UCN), tRNAThr, tRNALeu(CUN), and tRNAGlu in three cybrid cell lines derived from one affected subject (II-9) and three cybrid cell lines derived from one Chinese control subject (C59). The values for the latter are expressed as percentages of the average values for the control cell lines. The calculations were based on three independent experiments. The error bars indicate mean ± 2 S.D. P indicates the significance, according to the t test, of the differences between mutant and control cell lines.

