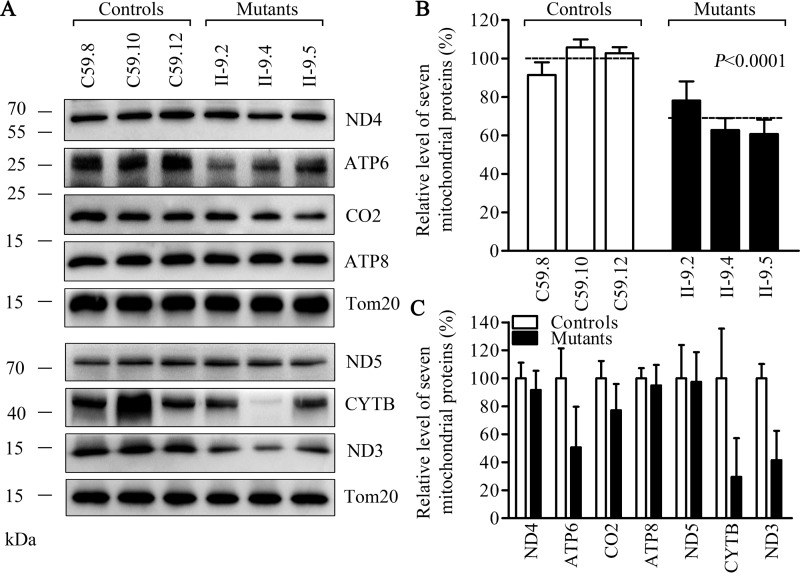
Figure 6.
Western blot analysis of mitochondrial proteins. A, 20 μg of total cellular proteins from various cell lines were electrophoresed through a denaturing polyacrylamide gel, electroblotted, and hybridized with 7 polypeptides (mtDNA-encoded subunits of respiratory complexes) and with Tom20 as a loading control. B, quantification of total mitochondrial protein levels. The levels of mitochondrial proteins in 3 mutant cell lines and 3 control cell lines were determined as described elsewhere (53, 54). C, quantification of 7 polypeptides. The levels of ND3, ND4, ND5, CO2, CYTB, ATP6, and ATP8 in three mutant cell lines and three control cell lines were determined as described elsewhere (53, 54). Graph details and symbols are explained in the legend to Fig. 4.

