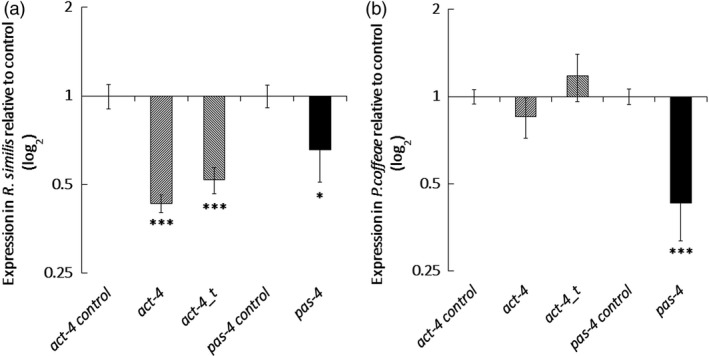
Figure 1.

Quantitative RT‐PCR Measurement of Transcript Knock‐down. Reduction is for act‐4 and pas‐4 expression following soaking in 100 μg/mL dsRNA for 24 h for (a) Radopholus similis and (b) Pratylenchus coffeae. Values are means ± SEM for four technical replicates of three biological replicates with significant loss of expression relative to nontargeting gfp dsRNA treatment indicated. Analysis is based on univariate ANOVA of log values with Tukey post hoc comparison to gfp, ***P < 0.001; *P < 0.05.
