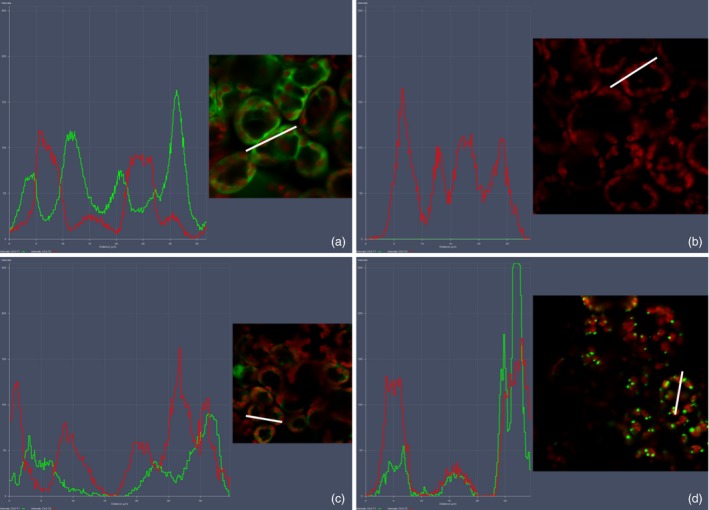
Figure 5.

Colocalization profiles of LG and chloroplasts. Colocalization profiles were generated using the colocalization feature of the Zeiss Zen software. (a) Positive control, pRIC3.0‐EGFP. (b) Negative control, pRIC3.0 empty vector. (c) Cytoplasmic LG. (d) cTP‐LG. Green and red curves correspond to EGFP fluorescence and the chlorophyll autofluorescence, respectively. White bars represent the area used to generate the colocalization profiles. Magnification = 40×. Shown here are representatives of several images taken over two independent sets of experiments.
