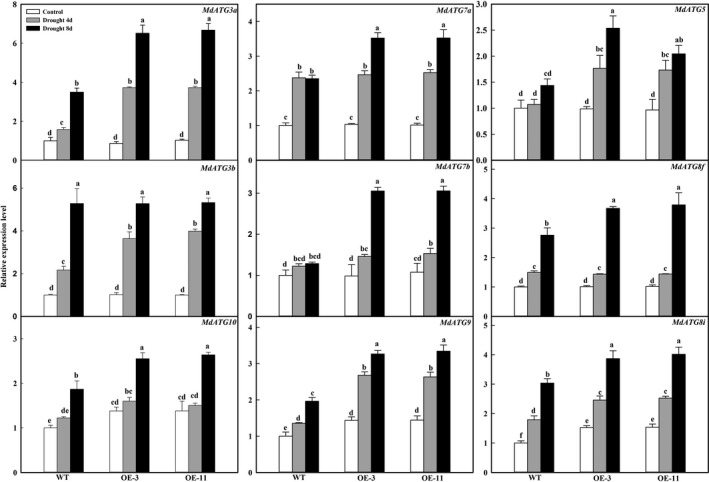
Figure 7.

Changes in transcription level of apple autophagy‐related genes during drought period. Total RNA was isolated from leaf samples collected at indicated times, and expression levels were calculated relative to expression of Malus EF‐1α mRNA. Data are means of three replicates with SD. Different letters indicate significant differences between treatments, according to one‐way ANOVA Tukey's multiple range tests (P < 0.05).
