Figure 3.

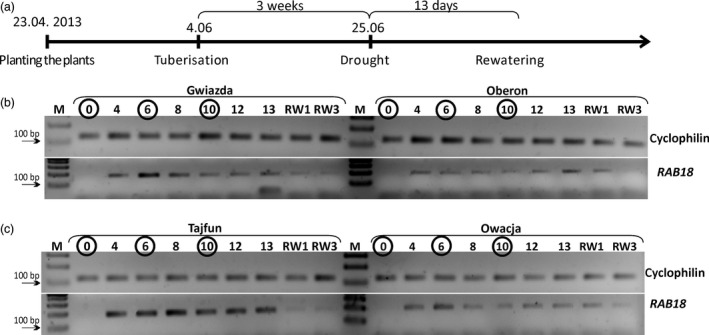
The scheme and molecular marker monitoring of the drought experiment. (a) Time course of the drought experiment. Drought was applied three weeks after the initiation of the tuberization process and was carried out for 13 days. On the 13th day, the plants were rewatered. (b and c) Expression profile of the RAB18 gene. Gel electrophoresis of RAB18 (PGSC0003DMG400003531) and cyclophilin (PGSC0003DMG400001630) cDNA RT‐PCR products on selected days of drought is shown. The results of the cultivar pairs Gwiazda/Oberon and Tajfun/Owacja are shown in panels b and c, respectively. The numbers above the gels indicate the subsequent days of drought; the numbers in circles show the time points when the plant RNA was isolated and subjected to the RNA‐seq analysis. RW—days after plants were rewatered; M—DNA molecular weight marker.
