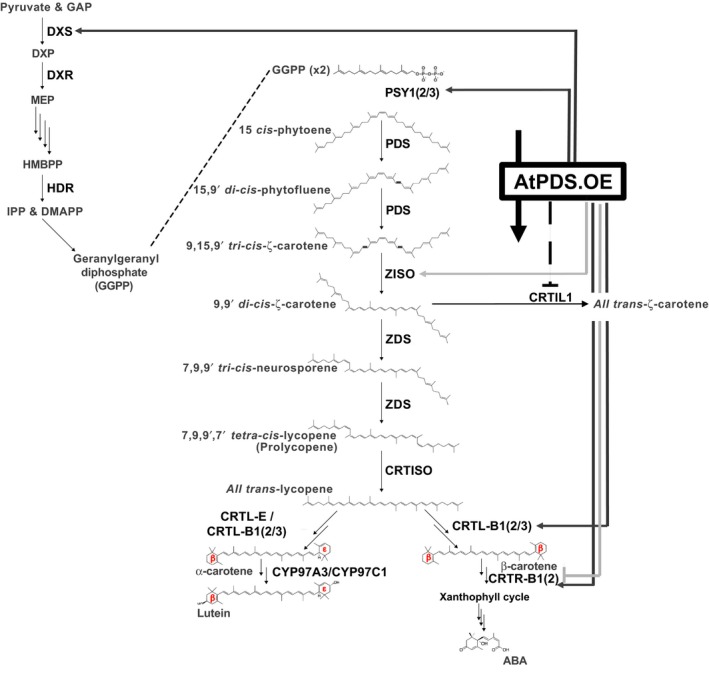
Figure 8.

Model of feedback and feedforward regulation induced by AtPDS overexpression in ripe fruit, leaves and flowers. Enzymes within the simplified MEP pathway are abbreviated in bold. DXS, deoxyxylulose 5‐phosphate (DXP) synthase; DXR, DXP reductase; HDR, 4‐hydroxy‐3‐methylbut‐2‐enyl diphosphate reductase. Enzyme products are abbreviated as follows: GAP, glyceraldehyde 3‐phosphate; DXP, deoxyxylulose 5‐phosphate; MEP, methyl‐d‐erythritol 4‐phosphate; HMBPP, 4‐hydroxy‐3‐methylbut‐2‐enyl diphosphate; IPP, isopentenyl diphosphate; DMAPP, dimethylallyl diphosphate; and GGPP, geranylgeranyl diphosphate. Carotenoid biosynthetic enzymes are abbreviated in bold: PSY1, 2 and 3, phytoene synthase 1, 2 and 3; PDS, phytoene desaturase; ZISO, ζ‐carotene isomerase; ZDS, ζ‐carotene desaturase; CRTISO, carotene isomerase; CRTIL1, CRTISO‐like 1; CRTL‐E (LCY‐E), lycopene ε‐cyclase; CRTL‐B1 and 2 (LCY‐B and BCYC, respectively), lycopene β‐cyclase; CYP97A3, carotene ε‐hydroxylase; CRTR‐B1 and 2, carotene β‐hydroxylase 1 and 2; and ABA is abscisic acid. Black dotted bar represents negative impacts on gene expression in response to AtPDS overexpression in ripe fruit. Dark grey arrows represent positive impacts by AtPDS overexpression in leaves. Light grey arrows/bars represent positive/negative impacts by AtPDS overexpression in anthesis flowers.
