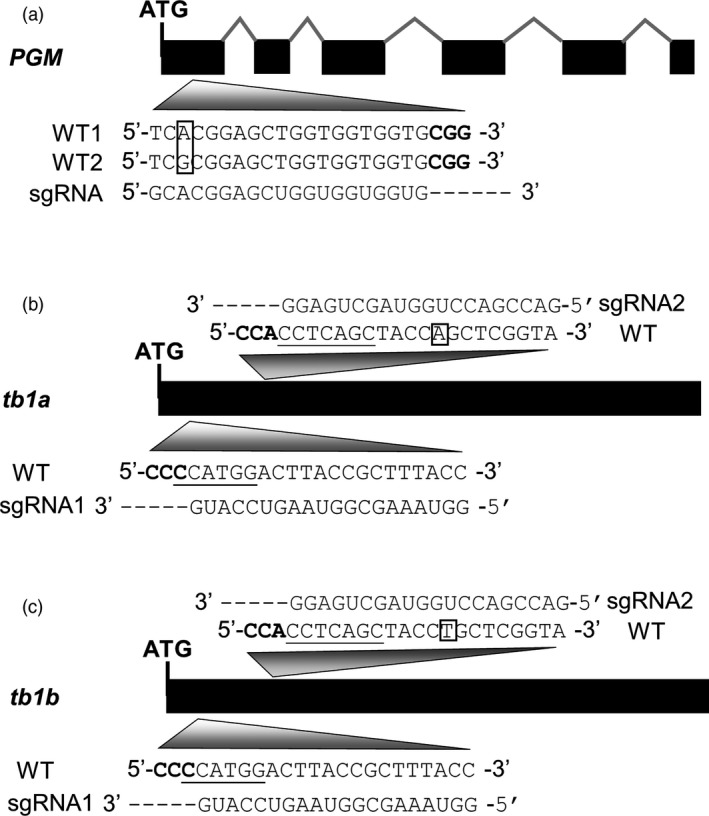
Figure 2.

Schematics of gene structures with exons (solid, black bars), introns (‘^’ lines) and sequences of target sites and guide RNAs. (a) PGM gene with two different alleles; boxed letters indicate the allelic SNP; PAM sequence is in bold. (b) and (c) Gene structures of tb1a and tb1b and corresponding guide RNAs. Boxed letters indicate the SNP between the two genes; sequences complementary to PAM are in bold. Underlined sequences indicate enzyme recognition sites used for mutant allele enrichment.
