Figure 3.

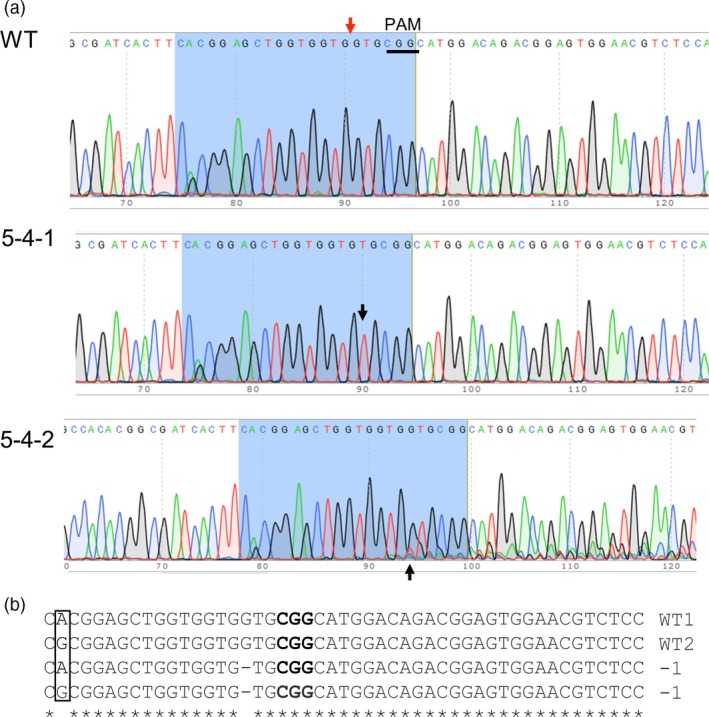
Representative sequencing results of the target regions within the PGM gene. (a) Chromatograms of DNA sequences in wild type (WT), homozygous mutant (5‐4‐1) and heterozygous mutant (5‐4‐2). The red arrow indicates the CRISPR cleavage site, and the PAM sequence is underlined in WT; black arrow head in 5‐4‐1 points to the deletion of G relative to the wild‐type PGM sequence; black arrow head in 5‐4‐2 points to double peak in presence of G and T, suggesting the deletion of G in some PCR products. (b) Alignment of partial sequences of different alleles of the PGM gene spanning the target region obtained by colony sequencing of PCR products of a heterozygous and the homozygous mutant plant, along with the wild‐type control. PAM sequence is in bold. The bases A and G highlighted in the box show the presence of an allelic SNP within the target region wild type.
