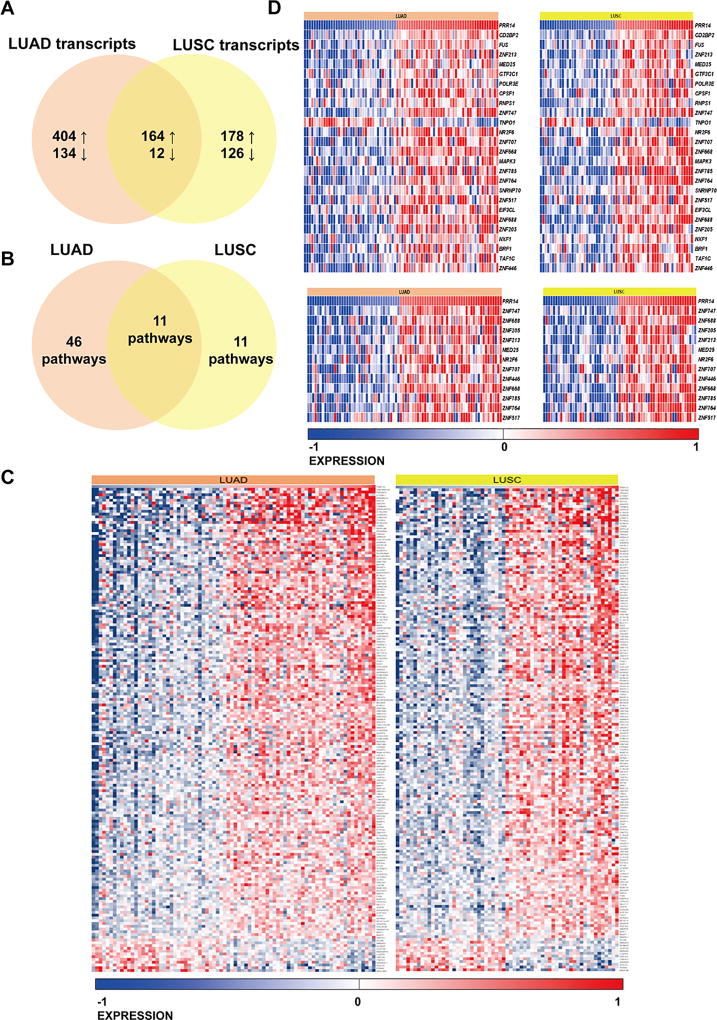
Fig 2.
Venn diagram presenting comparative analysis of differentially expressed genes between high- and low-PRR14 expressing LUAD and LUSC cases deposited in TCGA database. The cut-off of p<0.001 was considered significant to determinate differentially expressed transcripts (A). Venn diagram presenting pathways overrepresentation performed on DE transcripts unique for LUAD, common for LUAD and LUSC and unique for LUSC cases (B). (C) Heat map of common differentially expressed genes in LUAD and LUSC cases. (D) Heat maps presenting differentially expressed genes in two significantly enriched pathways Gene Expression and Generic Transcription Pathway (Reactome) in both LUAD and LUSC. The gene expression levels are normalized and log2 transformed reaching form −1 to +1 that corresponds to blue and red colors on heatmap.

