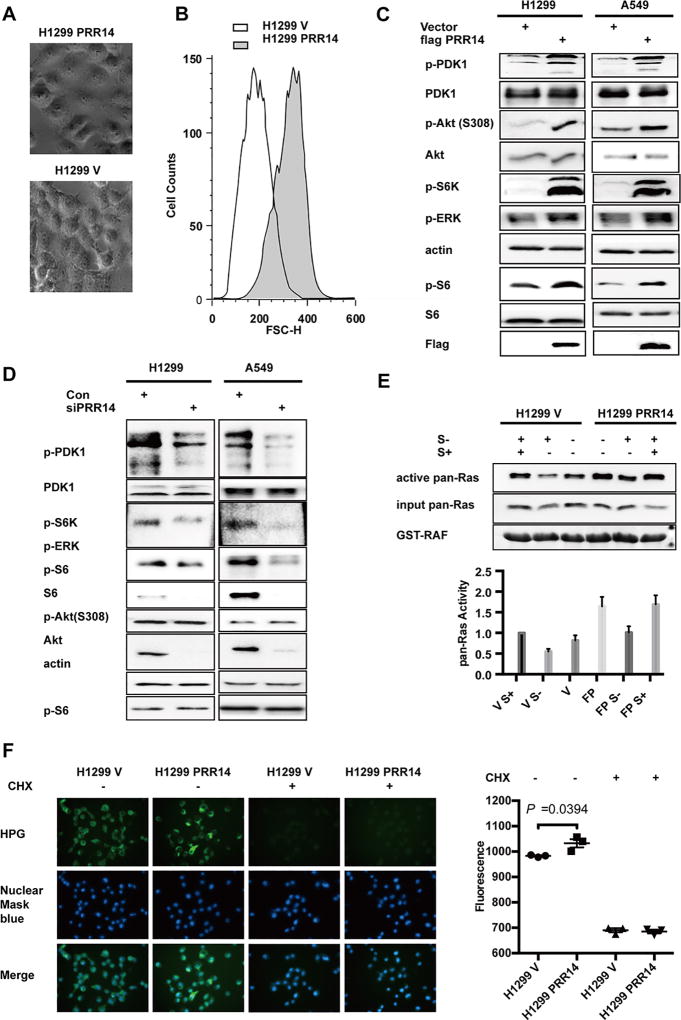
Fig 4. PRR14 increases PI3K/Akt/mTOR signaling pathway activity.
(A) Phase contrast images of H1299 PRR14 cell line and its control H1299 V; (B) FACS analysis of H1299 cell lines was performed using propidium Iodide with FACS Canto II. And representative distribution of cell size was shown. Several key components of the PI3K/Akt/mTOR signaling pathway were detected by immunostaining in both H1299 and A549 cell lines, when cells were transfected with either plasmid to increase PRR14 expression (C) or siRNA to reduce its expression (D). (E) Ras pull-down activation Assay was performed to compare total Ras activation between H1299 PRR14 and its control H1299 cell lines. The active Ras protein was normalized to total Ras protein and quantified. The numbers of relative abundance of active Ras protein are presented as the mean± S.D. (n = 3). (F) Newly synthesized proteins within 30 min were visualized and quantified in both H1299 PRR14 and its control cell lines in the presence or absence of CHX (50µg/ml) to compare the protein synthesis rate.

