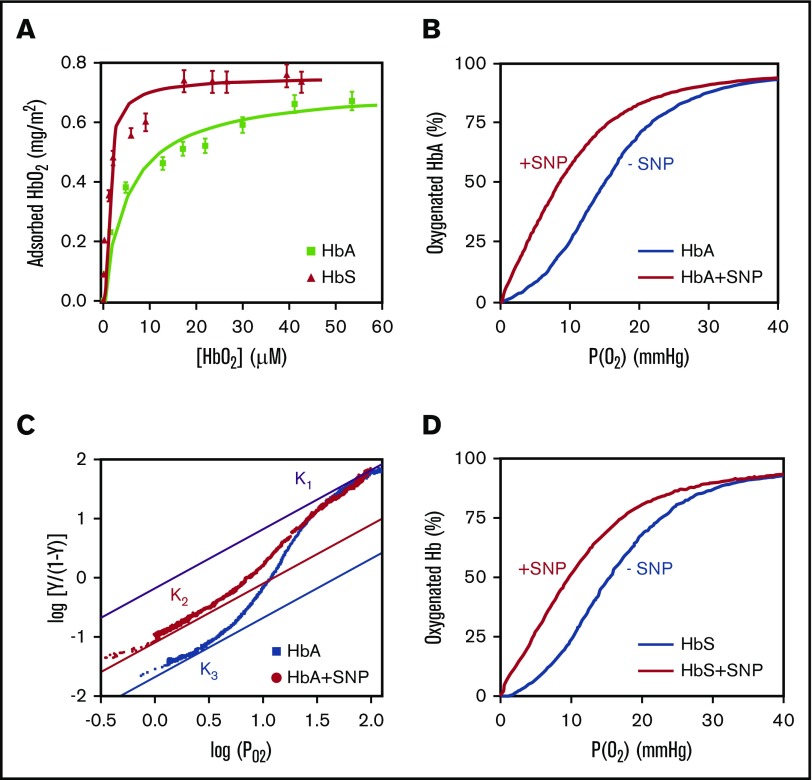
Figure 1.
Functional analysis of human HbA and HbS adsorbed on SNPs. (A) Adsorption isotherms of human HbA and HbS on SNPs. (B) Oxygen binding curve of HbA hemolysate at 37°C with and without SNPs. (C) Hill plot of the oxygen binding curves of purified HbA with and without SNPs at 37°C. The upper and lower asymptotes represent the limits for the high-affinity and low-affinity oxygen binding. K1 is the oxygen association equilibrium constant for the final oxygen binding step and is identical for free and adsorbed HbA. K2 and K3 are the association equilibrium constants for the initial oxygen binding of adsorbed HbA and free HbA, respectively. (D) Oxygen binding curves of HbS hemolysate at 37°C with and without SNPs. All the experiments were performed in 0.1 M phosphate buffer at pH 7.4. In these conditions, hemoglobin is totally adsorbed on SNPs.

