Figure 5.
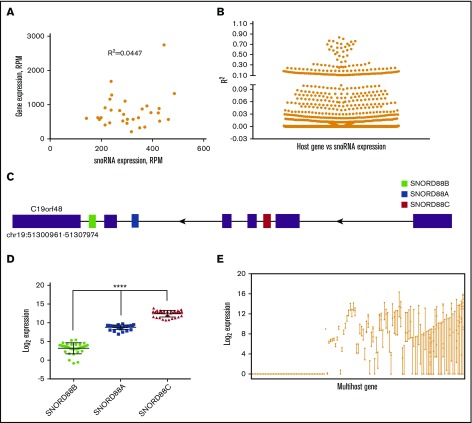
Correlation between host gene and snoRNAs expression. (A) Representative plot showing the correlation between the normalized expression of the host gene RPL7A and its encoded SNORD36B in AML. (B) Summary scatter plot showing the coefficient of determination (R2) of all host gene/snoRNAs pairs (N = 1379, mean ± SEM = 0.037 ± 0.102). (C) Organization of the human gene C19orf48 gene (drawing not to scale); exons are shown as ▪ and SNORD88B, −88A and −88C are shown in green-, blue-, or red-filled boxes, respectively. (D) Log-transformed normalized read counts in AML. Significance was determined by 1-way ANOVA followed by Tukey multiple comparisons test. (E) Plot showing the log-transformed median expression values for all expressed snoRNAs in a multihost gene (N = 130). Each line represents a distinct multihost gene.

